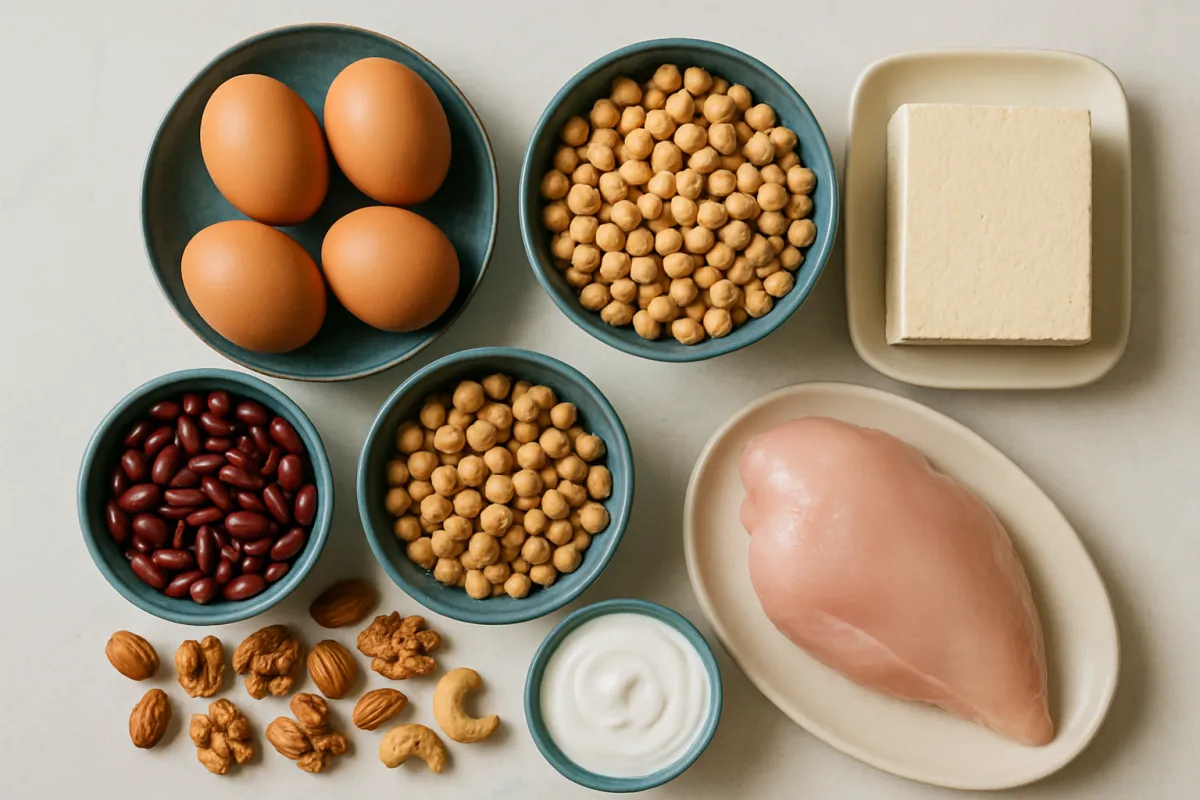
What's in this review
- How Much Zinc per Day? The Direct Answer
- Zinc Reference Intakes by Age, Sex and Life Stage
- Why the Adult Figure Splits by Sex
- Pregnancy and Breastfeeding Carry Separate Figures
- Infants, Children and Teenagers
- RDA, AI, UL and Daily Value: Four Numbers, Four Questions
- The 40 mg Upper Limit Is a Boundary, Not a Target
- Zinc and Copper: Why the Pair Is Discussed Together
- The Body Keeps No Ordinary Zinc Store
- Food Sources of Zinc: A Reference Table
- Which Foods Carry the Most Zinc per Serving
- Oysters and Shellfish: The Outlier at the Top
- Beef, Pork and Poultry: The Reliable Middle
- Dairy and Eggs
- Beans, Nuts, Seeds and Whole Grains
- Plant-Based Diets, Phytates and Why the Same Milligrams Do Not Land the Same
- Why No Absorption Percentage Appears on This Page
- Soaking, Sprouting, Fermenting and Leavening
- Fortification and the Cereal Wildcard
- An Illustrative Day That Reaches 11 mg
- Reading the Zinc Line on a Nutrition Facts Panel
- What a Supplement Facts Panel Tells You
- Lozenges, Nasal Products and the Cold Question
- Common Mistakes When Counting Zinc
- A Short Zinc-Forward Shopping List
- When the Zinc Question Belongs With a Clinician
- The Bottom Line
Short answer: Adult reference intakes for zinc are commonly cited near 11 milligrams a day for men and near 8 milligrams for women, with pregnancy near 11 milligrams and breastfeeding near 12, and a commonly cited ceiling of 40 milligrams counting food, fortification and supplements together. Oysters sit far above every other food; beef, crab, pork and pumpkin seeds follow. People eating no meat or seafood may need up to roughly 50 percent more.
Zinc is the nutrient people meet twice: once in a reference table, where the daily figure is small and unremarkable, and once at the pharmacy counter, where the amounts are far larger and the claims are far louder. The gap between those two encounters is most of what makes the question confusing. The reference figure answers what a population needs from food. Everything else is a different question with a different answer, and often a different person to ask.
This evidence review works through the commonly cited reference figures for zinc and why they split by age, sex and life stage, what the upper limit is set against and why copper keeps appearing beside it, where zinc actually sits in ordinary food, why the same milligrams behave differently on a plant-forward plate, and what a panel does and does not tell you. The wider table of reference figures sits in our daily nutrient intake reference, the closest sibling on the mineral side is our iron review, and you can sketch a rough day in the companion below. Everything here is general education describing approximate figures, not medical or dietary advice.
Key takeaways
- Adult reference intakes are commonly cited near 11 mg a day for men and near 8 mg for women, with pregnancy near 11 mg and breastfeeding near 12 mg. Confirm your own row with the publishing health authority.
- The sex split comes from body size and the daily losses that scale with it, not from blood loss, which is why the zinc figure for women does not fall after about age 51 the way the iron figure does.
- Oysters sit far above every other food. Below them the range is ordinary: braised beef chuck near 7 mg for three ounces, then crab, pork, baked beans, dark poultry and pumpkin seeds between roughly 2 and 3 mg a serving.
- Phytate in whole grains, legumes, nuts and seeds binds zinc in the gut, which is why reference publications commonly note that people eating no meat or seafood may need as much as roughly 50 percent more.
- The commonly cited 40 mg ceiling counts food, fortification and supplements together and is set against copper status, so anything concentrated belongs with a clinician or pharmacist rather than a shelf.
How Much Zinc per Day? The Direct Answer
For healthy adults, the commonly cited daily figures are roughly 11 milligrams for men aged 19 and older and roughly 8 milligrams for women aged 19 and older. Pregnancy is commonly cited near 11 milligrams and breastfeeding near 12 milligrams for adults. These are Recommended Dietary Allowances published by the Food and Nutrition Board of the National Academies as part of the Dietary Reference Intakes.
Two cautions belong with that answer before anything is built on it. First, reference intakes are published by national health authorities, are reviewed periodically, and do get revised, so the current figure for your specific age, sex and life stage should be confirmed against the publishing body rather than against any article. Second, an RDA is a population reference designed to cover the requirement of nearly all healthy people in a group. It is not a personal quota, and a day that lands under it is not a finding about anyone.
The figures themselves are modest, which is worth noticing early. Eight to eleven milligrams is reached by a fairly ordinary mixed day of food without anyone aiming at it, which is why zinc rarely appears in general eating advice. The interesting part of the question is not the number. It is what happens to the number when the plate changes shape, which the rest of this evidence review is largely about. Set your own reference figure in the companion below and the arithmetic in each section runs against it.
Zinc Reference Intakes by Age, Sex and Life Stage
The published reference table runs from infancy through later adulthood. The values below are the commonly cited figures in milligrams per day. The infant figure for the first six months is an Adequate Intake rather than an RDA, a distinction covered further down.
| Group | Zinc, mg per day |
|---|---|
| Infants 0 to 6 months | 2 (AI) |
| Infants 7 to 12 months | 3 |
| Children 1 to 3 years | 3 |
| Children 4 to 8 years | 5 |
| Children 9 to 13 years | 8 |
| Boys 14 to 18 years | 11 |
| Girls 14 to 18 years | 9 |
| Men 19 years and older | 11 |
| Women 19 years and older | 8 |
| Pregnancy, 14 to 18 | 12 |
| Pregnancy, 19 and older | 11 |
| Breastfeeding, 14 to 18 | 13 |
| Breastfeeding, 19 and older | 12 |
Three features are worth noticing before any single row. The climb from infancy to adulthood is gradual rather than jumpy, which is unusual on a reference table and reflects a requirement that tracks body size fairly smoothly. The adult rows do not change with age, so a man of 25 and a man of 75 are given the same figure. And the pregnancy and breastfeeding rows sit above the non-pregnant figure rather than below it, which is the opposite of the pattern iron shows. Treat this table as a reproduction of commonly cited figures and confirm your own row against the current official publication.
Why the Adult Figure Splits by Sex
The gap between roughly 11 milligrams for men and roughly 8 for women is real but small, and the reason behind it is undramatic. Reference intakes for zinc are derived from the amount needed to replace what the body loses each day, and those losses scale broadly with body size and lean tissue mass, which is larger on average in men. A bigger body running the same processes sheds a little more zinc, so it is given a slightly larger figure.
That mechanism is worth stating plainly because it differs from the one behind the better known sex split on the reference table. The iron gap is driven by menstrual blood loss, which is why it is large, why it applies only during the reproductive years, and why the commonly cited iron figure for women drops by more than half at around age 51. Our iron review works through that in full.
Zinc has none of that structure. The figures are set by body size, and body size does not change category on a birthday, so the adult rows hold from 19 upward for both sexes. Anyone who has learned the shape of the iron table and expects zinc to behave the same way is carrying across a rule that does not apply here, which is one of the quieter ways reference tables get misread.
Pregnancy and Breastfeeding Carry Separate Figures
Both figures sit above the non-pregnant adult figure, and both are commonly cited only modestly higher: near 11 milligrams in pregnancy and near 12 while breastfeeding for adults, against 8 for other adult women. The teenage rows sit a milligram higher again, at 12 and 13, reflecting growth continuing alongside the additional demand.
The reason for the increase is straightforward. Zinc is used in building new tissue, so a pregnancy accumulating a whole new body needs more of it, and milk carries zinc out of the body every day, which has to be replaced. What is more interesting is how small the increase is compared with the iron case, where the pregnancy figure is more than half again above the adult female figure. Different nutrients scale differently with the same life stage, and there is no general rule that pregnancy multiplies everything.
Anything specific to a pregnancy or to breastfeeding belongs entirely with the clinician providing that care, including any question about supplements, which antenatal care already covers as a matter of routine. This evidence review offers no view on it. Our note on high fiber foods during pregnancy covers a related question from the same life stage and makes the same handover.
Infants, Children and Teenagers
The infant rows are the smallest on the table and are set differently from the rest. The commonly cited figure for the first six months is around 2 milligrams as an Adequate Intake, anchored on the intake of a healthy breastfed baby rather than derived from a measured requirement. From seven to twelve months the figure is commonly cited near 3 milligrams, by which point complementary foods are usually part of the picture.
Childhood figures then climb with body size: near 3 milligrams at ages one to three, near 5 at four to eight, and near 8 at nine to thirteen. That last figure is the same as the adult female figure, which sometimes surprises people, and it reflects the growth happening in those years rather than an error.
At fourteen the rows separate for the first time, with boys commonly cited near 11 milligrams and girls near 9, a split that then persists into the adult rows in slightly adjusted form. Infant and child feeding is a paediatric matter. Any question about a specific baby or child, and any question about a zinc-containing product intended for one, belongs with a paediatric clinician or pharmacist rather than a reference page.
RDA, AI, UL and Daily Value: Four Numbers, Four Questions
Four different figures circulate around any mineral, and confusing them is the most common way a reference table gets misread. A Recommended Dietary Allowance is an intake estimated to meet the requirement of nearly all healthy people in a group. It is the figure most of this page is about, and zinc has one for everyone past the first six months of life.
An Adequate Intake is the fallback used where evidence is not strong enough to set an RDA. It is typically anchored on the intake observed in apparently healthy populations, which for infants under six months means the intake of a healthy breastfed baby. That single row is the only place an Adequate Intake appears on the zinc table.
A Tolerable Upper Intake Level is a ceiling rather than a target, describing the highest routine intake likely to pose no risk of adverse effects in almost everyone. Readers misread it constantly, because a number printed in a nutrition table looks like something to aim at.
The fourth figure is the Daily Value, and it is a labeling number rather than a nutrition one. It is a single reference chosen so that one percentage can be printed for every reader of a package, commonly cited at 11 milligrams for zinc. It is not tailored to anyone, which is why the milligram figure beside it is the more useful line. Our magnesium review works through the same four ideas on a mineral whose upper limit behaves differently again.
The 40 mg Upper Limit Is a Boundary, Not a Target
The Tolerable Upper Intake Level for zinc is commonly cited at roughly 40 milligrams a day for adults, with lower ceilings down the age table: near 34 milligrams for ages 14 to 18, near 23 for ages 9 to 13, near 12 for ages 4 to 8, and near 7 for ages 1 to 3. Like the iron ceiling and unlike the magnesium one, this limit counts every source together, meaning zinc from food, zinc added to fortified products, and zinc from supplements.
That structural point is worth dwelling on, because it changes the arithmetic completely. A day of ordinary food does not come close to 40 milligrams for most people, so food alone is not where the ceiling bites. What the ceiling is actually describing is the total once something concentrated is added on top, which is precisely the situation where nobody is doing the addition.
The effect the limit is set against is not immediate discomfort. It concerns copper status, which is the subject of the next section, and which cannot be sensed or self-monitored the way an upset stomach can. That is a meaningful difference from the iron ceiling, which is anchored on gastrointestinal effects a person would notice. One further caveat matters: the upper limit does not apply to people taking zinc under medical supervision for a diagnosed reason. Everything past ordinary food is clinical territory.
Zinc and Copper: Why the Pair Is Discussed Together
Zinc and copper are handled by overlapping machinery in the intestine, and the practical consequence is a one directional competition: sustained high zinc intakes are described as reducing the absorption of copper. That interaction is the reason the two minerals appear together in almost every serious reference on either of them, and it is the reason the zinc ceiling exists where it does.
The mechanism usually described involves the intestinal cells adjusting a binding protein in response to zinc, which then holds copper inside those cells so that it is shed rather than absorbed. This evidence review is describing the shape of the mechanism rather than asserting the size of the effect, because published estimates of magnitude vary with the amount, the duration and the person.
Two practical points follow, and they pull in opposite directions. The first is that ordinary food does not create this problem. Meals reaching 8 to 12 milligrams of zinc are nowhere near the territory the interaction is described in, so nobody eating normally needs to think about copper. The second is that anything concentrated does raise the question, and it is not a question a reader can answer at home, because copper status is established by testing rather than by feel. That asymmetry is the whole argument for handing the supplement decision to a clinician or pharmacist.
The Body Keeps No Ordinary Zinc Store
Iron has ferritin. Vitamin D has fat tissue. Vitamin B12 has a liver reserve measured in years. Zinc has nothing comparable, and that single fact explains several things about how it is discussed. Most of the body’s zinc is inside tissues doing structural and catalytic work rather than sitting in reserve waiting to be drawn on.
Balance is instead maintained dynamically, by adjusting absorption and losses. When intake falls, a larger share of what arrives is taken up and less is shed. When intake is generous, the reverse happens. That regulation is described as effective across a wide ordinary range, which is a large part of why zinc rarely becomes an issue for people eating varied food.
The consequence worth carrying away is directional rather than numerical. Zinc favours regular intake over occasional large amounts, because there is no reservoir to fill on a good day and draw down on a bad one. That is a general principle about the mineral rather than an instruction about timing, and it is one reason the food question and the supplement question are genuinely different questions rather than the same question at two scales.
Food Sources of Zinc: A Reference Table
The figures below are commonly cited, approximate values for ordinary servings. They shift with variety, cut, brand, fortification and preparation, so read them as reference approximations rather than as measurements of anything on your own counter. The panel on your own package is always the more reliable figure.
| Food | Serving | Zinc, roughly |
|---|---|---|
| Oysters, cooked | 3 oz | roughly 30 mg and upward, varying widely with species and preparation |
| Beef chuck roast, braised | 3 oz | ~7 mg |
| Blue crab, cooked | 3 oz | ~3.2 mg |
| Lobster, cooked | 3 oz | ~3.4 mg |
| Baked beans, canned | 1/2 cup | ~2.9 mg |
| Pork loin chop, cooked | 3 oz | ~2.9 mg |
| Fortified breakfast cereal | 1 serving | varies by brand; read the panel |
| Chicken, dark meat, cooked | 3 oz | ~2.4 mg |
| Pumpkin seeds, roasted | 1 oz | ~2.2 mg |
| Yogurt, low fat | 8 oz | ~1.7 mg |
| Cashews | 1 oz | ~1.6 mg |
| Chickpeas, cooked | 1/2 cup | ~1.3 mg |
| Swiss cheese | 1 oz | ~1.2 mg |
| Oatmeal, instant | 1 packet | ~1.1 mg |
| Milk | 1 cup | ~1 mg |
| Almonds, roasted | 1 oz | ~0.9 mg |
| Kidney beans, canned | 1/2 cup | ~0.9 mg |
| Chicken breast, roasted | 3 oz | ~0.9 mg |
| Cheddar cheese | 1 oz | ~0.9 mg |
| Green peas, cooked | 1/2 cup | ~0.5 mg |
| Flounder or sole, cooked | 3 oz | ~0.3 mg |
Two rows deserve a note. The oyster row is deliberately given as a range rather than a single figure, because published values for a three ounce serving differ substantially by species and by how it was cooked, and picking one number would misrepresent that spread. The fortified cereal row has no figure at all, because the amount added is a manufacturer’s decision rather than a property of the grain.
Which Foods Carry the Most Zinc per Serving
Zinc per common serving
Milligrams per typical portion, against adult reference intakes commonly cited near 8 to 11 mg a day. Oysters and fortified cereals are left out, the first because published figures vary too widely to plot and the second because the amount added varies by brand. Illustrative approximations.
Bars scale to braised beef chuck at 100 percent. Commonly cited approximations that vary with variety, cut, brand and preparation, and not personal targets. Bar length is milligrams on the plate rather than milligrams absorbed.
The shape of that chart is the useful part. There is one tall bar, a cluster of moderate ones, and then a long tail of foods contributing about a milligram each. That is a different distribution from iron, where several plant foods sit at the top by milligram. For zinc the leaders are animal foods with legumes and seeds close behind, and no single ordinary serving covers a full day.
The tail matters more than it looks. A day built from six or seven of those one milligram entries plus one moderate serving is already in the neighbourhood of an adult figure, which is why zinc rarely requires anybody to plan around it.
Oysters and Shellfish: The Outlier at the Top
Oysters are the single most extreme entry on any mineral table on this site, carrying several times an adult reference intake in one modest serving. That is why they are quoted in every discussion of zinc, and it is also why they are almost useless as practical advice, since very few people eat them regularly.
This evidence review gives a range rather than a figure for them on purpose. Published values for a three ounce serving differ substantially depending on the species, on where they were harvested, and on whether the serving was steamed, raw or breaded and fried, and the honest presentation of a value that moves that much is a range with the reason attached.
The rest of the shellfish category is far more ordinary and more useful. Cooked lobster is commonly cited near 3.4 milligrams for three ounces and blue crab near 3.2, which puts both in the same band as pork and dark poultry rather than anywhere near oysters. Finned fish is lower still, with flounder or sole commonly cited near 0.3 milligrams, which is a reminder that seafood is not one category for this mineral. Our salmon protein review covers a fish that earns its place on other columns entirely.
Beef, Pork and Poultry: The Reliable Middle
Red meat is the workhorse of the zinc table for anyone who eats it. Braised beef chuck is commonly cited near 7 milligrams for a three ounce portion, which is most of an adult figure in one serving, and a pork loin chop near 2.9. Within poultry the split is by colour: dark meat is commonly cited near 2.4 milligrams for three ounces and roasted breast near 0.9, a difference of more than two to one within the same bird.
That colour pattern echoes the one iron shows, and for related reasons involving the tissue makeup of harder working muscle, though zinc is not carried in heme the way iron is. Our ground beef protein review and our chicken breast calorie review cover the same foods from other angles.
One further point makes animal foods more useful here than a milligram column alone suggests. They carry no phytate, so the zinc in them is not competing with a binding agent in the same mouthful, which is the subject of a later section. That is why a mixed day reaches a reference figure with less attention than a fully plant based one, and why the published adjustment for people eating no meat or seafood exists at all.
Dairy and Eggs
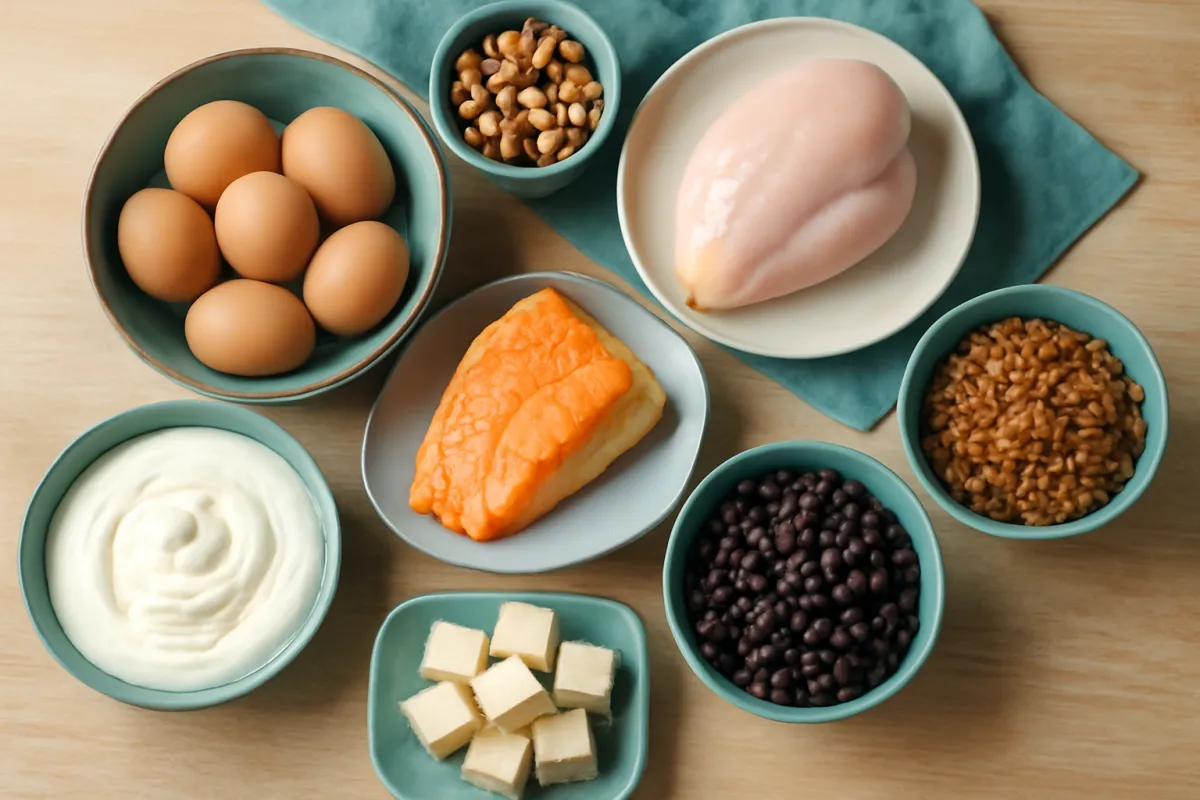
Dairy sits in the long tail rather than the leading group, and it earns its place through repetition rather than concentration. A cup of milk is commonly cited near 1 milligram, an ounce of Swiss cheese near 1.2, an ounce of cheddar near 0.9, and an eight ounce serving of low fat yogurt near 1.7. None of those is a large figure, but they appear several times in an ordinary day.
Eggs contribute a smaller amount again and are rarely quoted as a zinc food, which is a useful corrective to the habit of treating every protein source as interchangeable across every mineral. A food’s standing changes completely depending on which column is being read, which is one of the arguments our daily nutrient intake reference makes across the whole table.
For anyone building a day around dairy, the practical read is that it stacks. Milk in coffee, yogurt at breakfast and cheese on a sandwich is three entries near a milligram each, which is a meaningful share of an 8 milligram figure without any of them looking like a zinc food. Our Greek yogurt protein review covers the same foods on the column they are better known for.
Beans, Nuts, Seeds and Whole Grains
The plant side of the zinc table is led by seeds and legumes. An ounce of roasted pumpkin seeds is commonly cited near 2.2 milligrams and an ounce of cashews near 1.6, which puts both alongside poultry rather than at the bottom of the list. A half cup of canned baked beans is commonly cited near 2.9, chickpeas near 1.3 and kidney beans near 0.9. Whole grains contribute steadily, with an instant oatmeal packet commonly cited near 1.1 milligrams.
Two features make this group efficient beyond the milligram figure. These foods are cheap and shelf stable, so they survive the gap between intention and a real Tuesday, and they pay into several columns at once, carrying fiber, plant protein, magnesium and potassium in the same serving. That is why they sit near the top of our high-fiber foods list and appear in our protein without meat note as well.
The caveat is the one this evidence review keeps circling back to. These same foods carry phytate, which binds zinc in the gut, so the milligram figure on the table overstates what a plant-forward plate delivers relative to an animal one. That is not a reason to eat fewer of them. It is a reason the published reference figures come with a note attached, which the next two sections work through.
Plant-Based Diets, Phytates and Why the Same Milligrams Do Not Land the Same
Reference intake publications commonly note that people eating no meat or seafood may require as much as roughly 50 percent more zinc than the published figure. Applied to the commonly cited adult figures, that adjustment moves 11 milligrams toward roughly 16 and 8 milligrams toward roughly 12, which are noticeably harder numbers to reach from the same foods.
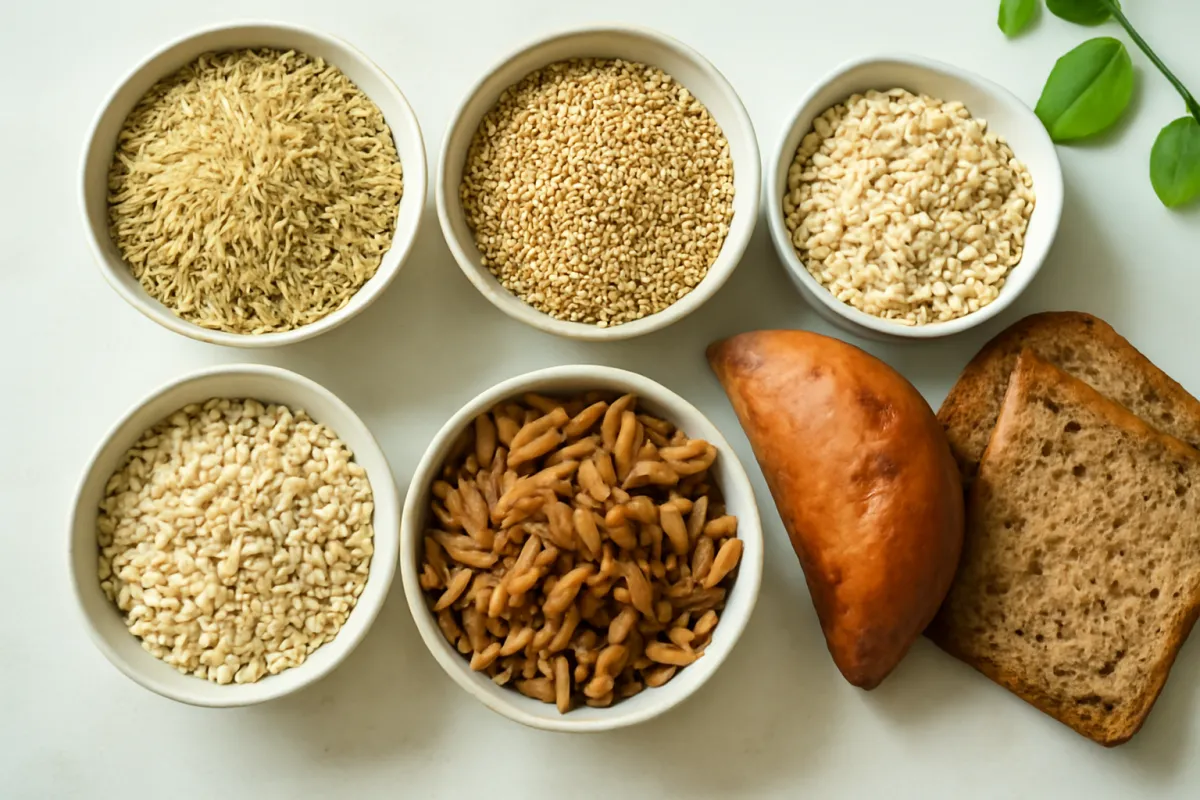
The reason is phytate, also called phytic acid, the storage form of phosphorus in plant seeds. It binds zinc and several other minerals in the gut and holds them in a form the intestine cannot take up. Whole grains, legumes, nuts and seeds all carry it, and those are precisely the foods that also carry the plant zinc, so the binding agent and the mineral arrive in the same mouthful.
The honest framing is that this is not a reason to avoid any of those foods. The net contribution stays clearly positive, since a food carrying both is still delivering more zinc than a food carrying neither. What the published adjustment describes is a shift in the whole scale rather than a warning about individual items. Anyone eating this way with a specific concern should raise it at an appointment rather than adjusting on the strength of a general figure, since the question is answered by a clinician who can see the rest of the picture.
Why No Absorption Percentage Appears on This Page
It would be easy to give a figure here for how much of the zinc in a meal is absorbed, and this evidence review is not going to, for a reason worth explaining rather than hiding. Published estimates vary widely between studies, populations, meal compositions and methods, and they vary further with the zinc status of the person eating.
That last point is the awkward one for any fixed number. Uptake rises when the body’s zinc is low and falls when it is replete, which means the percentage is not a property of the food at all. It is a property of the meal and the eater together. A number that changes with the diner cannot honestly be printed next to a food, and printing one anyway is how a reference page starts to mislead while looking more precise.
What can be said is directional and still useful. Phytate reduces uptake, animal foods carry none of it, preparation methods that break phytate down help, and the published adjustment for people eating no meat or seafood exists because the aggregate effect is large enough to matter. That is enough to reason with. Anyone who needs a real figure for a real person needs testing and a clinician, not a percentage from an article. Our iron review declines the same question for the same reason.
Soaking, Sprouting, Fermenting and Leavening
Since phytate is the obstacle, the methods that reduce it are the practical lever, and all four of them are ordinary kitchen practice rather than anything technical. Soaking dried beans and grains before cooking, sprouting seeds and pulses, fermenting doughs and batters, and using leavened rather than unleavened bread are all described as lowering phytate content to varying degrees.
The mechanism behind most of them is the same. Plant seeds contain an enzyme that breaks phytate down, and it becomes active when the seed is wet, warm and given time, which is what soaking, sprouting and a long fermentation all provide. That is why a slowly leavened loaf is described differently from a flatbread made in minutes, and why the traditional handling of pulses in many cuisines involves an overnight soak.
Two honest limits belong with this. The size of the reduction depends on the food, the method, the time and the temperature, so no single figure describes it, and this evidence review is not going to invent one. And none of it is necessary for anyone eating a mixed diet, since the adjustment exists for the plant-forward case. Using canned beans, which have already been soaked and cooked, captures part of the benefit with no effort at all. Our grocery list method covers the shopping side of the same habit.
Fortification and the Cereal Wildcard
Fortified breakfast cereals are the least predictable line on any mineral table, and zinc is no exception. Fortification is the practice of adding a nutrient that was not there in quantity, and it is a manufacturer’s decision rather than a property of the grain, so two boxes side by side on the same shelf can differ by a wide margin with nothing on the front of the pack to signal it.
That is why the cereal row in the table above carries no number. A serving declaring 25 percent of the labeling Daily Value is supplying roughly 2.8 milligrams, which would put it in the same band as a pork chop, while an unfortified cereal of the same grain might supply a fraction of that. Neither figure can be inferred from the ingredient.
The consequence for anyone counting is that the panel is the only source for this category. It also makes fortified products a real consideration in the upper limit arithmetic, since a heavily fortified breakfast plus anything else concentrated adds up faster than either alone suggests. Fortification rules are set by national regulators and are revised over time, so the panel on the package is the current fact rather than anything stated here.
An Illustrative Day That Reaches 11 mg
Here is one illustrative day assembled from the reference table above, built against the commonly cited 11 milligram figure for adult men because it is the larger of the two adult figures. It is an example of the arithmetic and not a meal plan, a recommendation, or a claim about any health outcome.
| Meal | Foods | Zinc |
|---|---|---|
| Breakfast | Fortified cereal whose panel declares ~2 mg, 1 cup milk (~1 mg) | ~3 mg |
| Lunch | 3 oz cooked dark chicken meat (~2.4), 1/2 cup chickpeas (~1.3) | ~4 mg |
| Snack | 1 oz cheddar cheese (~0.9) | ~1 mg |
| Dinner | 3 oz cooked pork loin chop (~2.9) | ~3 mg |
| Total | ~11 mg |
Three details in that day matter more than the total. The breakfast line depends entirely on a panel, since a different box could put it anywhere from almost nothing to several milligrams. No single item carries the day, which is the practical shape of a mineral whose leaders are moderate rather than dominant. And the same day eaten without the meat lines would fall by more than half while also being read against a higher reference figure, which is the plant-forward adjustment showing up in one worked example rather than in the abstract.
Build your own version in the companion below and the same arithmetic runs against whichever reference figure applies to you.
Where an illustrative 11 mg day comes from
Shares of the worked day above, by meal, against the commonly cited 11 mg figure for adult men. Reference approximations, not a meal plan.
Segments sum to 100 percent of the illustrative 11 mg day. Milligrams on the plate rather than milligrams absorbed, and approximations rather than a personal target.
The distribution says something the table does not. Every meal contributes and none of them dominates, which is a different picture from a nutrient where one food can carry a whole day. Swap the fortified cereal for an unfortified one and the day drops by nearly a fifth without anything visible changing on the plate.
Reading the Zinc Line on a Nutrition Facts Panel
Zinc is not among the nutrients that must always be declared on the United States Nutrition Facts panel, which puts it in the same position as magnesium rather than iron. So the line is present on some packages and absent on others, and its absence tells you nothing about the food.
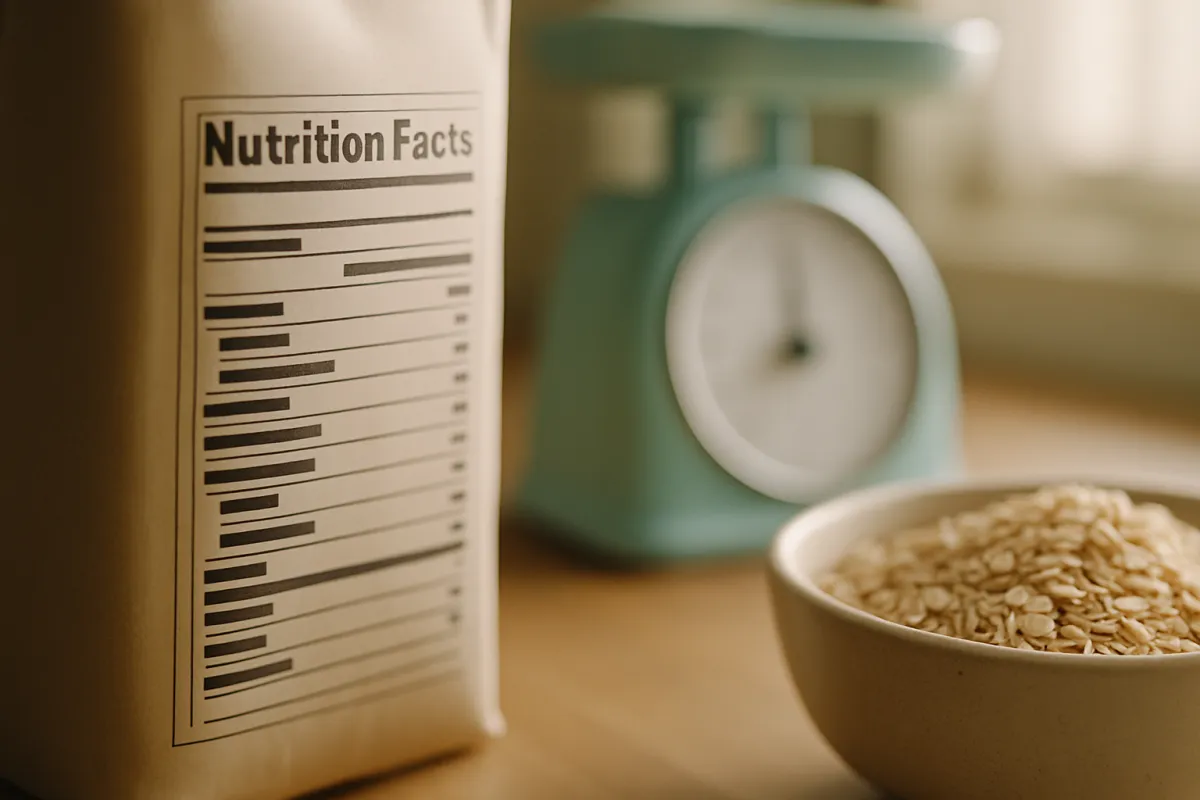
Where it does appear, the percentage is calculated against a Daily Value commonly cited at 11 milligrams for adults. That figure matches the commonly cited reference intake for adult men and sits above the figure for adult women, so a panel percentage reads about right for one group and slightly low for the other. A product showing 25 percent is supplying roughly 2.8 milligrams whoever is reading it.
The general advice holds here as with every mineral: read the milligram figure and treat the percentage as a rough screen, because milligrams are absolute and addable while percentages depend on a denominator you did not choose. Our nutrition label walkthrough covers the panel as a whole. Labeling rules are set by the FDA and can be revised, so check the agency’s current guidance rather than any article for what must be declared and against what Daily Value.
What a Supplement Facts Panel Tells You
This evidence review does not recommend any supplement, does not suggest an amount, and will not tell any reader whether they need one. What it can do is explain how to read a panel, which is a comprehension skill rather than a recommendation, and which matters here because of one specific feature.
Zinc in a product is always bound to a partner compound, with gluconate, sulfate, acetate and picolinate among the forms commonly seen. The compound weighs more than the elemental zinc inside it, so the figure that describes what is actually being taken is the elemental zinc figure on the Supplement Facts panel rather than any larger number that may appear elsewhere on the package. That is exactly the same reading trap our iron review describes for a different mineral.
The reason this matters more for zinc than for most nutrients is the ceiling. The commonly cited 40 milligram upper limit counts food, fortification and supplements together, so anything concentrated lands on top of a day that already contains some, and the effect the ceiling is set against involves copper status, which nobody can monitor at home. That is the argument for taking the question to a doctor, pharmacist or registered dietitian rather than resolving it in an aisle.
Lozenges, Nasal Products and the Cold Question
Zinc is unusual among minerals in having a widely known association with the common cold, and it is the part of this subject where the gap between a nutrition question and a clinical one is widest. A lozenge is not food, the amounts involved are not reference intake amounts, and the question of whether such a product does anything is a clinical question rather than a dietary one. This evidence review takes no position on it.
Two things are worth saying plainly instead of a verdict. The first is that products taken into the nose have been the subject of safety concerns regarding the sense of smell, and anything intended for nasal use belongs with a pharmacist or doctor and with the current advice of the relevant regulator rather than with a general nutrition page. The second is the arithmetic point that runs through this whole evidence review: anything in this category counts toward the same ceiling that food and fortification count toward.
The honest summary is that the reference intake question and the lozenge question are two different subjects that happen to share a mineral. Everything above about 8 to 11 milligrams from food is a description of ordinary eating. Nothing in it transfers to a product designed around a different purpose, and treating one as evidence about the other is the most common error in this area.
Common Mistakes When Counting Zinc
The first mistake is carrying the iron rules across. The two minerals sit next to each other on every table and behave differently in almost every respect, including the reason for the sex split, the direction of the age adjustment, what the ceiling is set against and whether the body holds a reserve.
The second is treating milligrams on the plate as milligrams absorbed. A plant-forward day and a mixed day with identical totals are not delivering the same thing, which is precisely why the published adjustment exists.
The third is inferring the zinc in a fortified product from the grain rather than the panel, when the added amount is a manufacturer’s choice. The fourth is the reverse of it, which is assuming the absence of a zinc line on a package means the food contains none, when zinc is simply not a mandatory declaration.
The fifth is quoting the oyster figure as though it were practical advice, when very few people eat oysters regularly and the published values for them vary widely. The sixth is over-tracking. Zinc does not need a spreadsheet, and an ordinary varied day reaches the commonly cited figures without anyone aiming at them. Our daily nutrient intake reference makes the same case across the whole table, and our balanced meal method is the plate level version of it.
A Short Zinc-Forward Shopping List
A compact list beats a comprehensive one, and for zinc it is short and cheap. For the leading group, if meat is part of the pattern, a braising cut of beef, a pork loin chop and dark poultry meat cover more ground per pound spent than anything else in the shop.
For the plant middle, pumpkin seeds, cashews, canned baked beans, canned chickpeas and rolled or instant oats. Four of those five keep indefinitely, and the canned pulses arrive already soaked and cooked, which is the preparation step that matters here doing itself on a factory line.
For the incidentals that stack, milk, plain yogurt and a hard cheese, each contributing around a milligram a serving and each appearing more than once in most days. If shellfish is affordable and to taste, crab and lobster sit in the same band as pork rather than anywhere near the oyster figure.
That basket overlaps almost completely with a fiber-forward and a protein-forward one, so it can be run alongside our grocery list method without a second trip. Nothing on it is a prescription, and no shopping list is a substitute for advice about a specific situation.
When the Zinc Question Belongs With a Clinician
There are five situations where a general nutrition article stops being the right source, and naming them explicitly is more useful than leaving them implied. The first is any thought of taking a zinc supplement, for the reasons set out above, since the ceiling counts every source and the effect it guards against is not something anyone can feel.
The second is pregnancy or breastfeeding, where the figures differ and where antenatal or postnatal care already covers this ground. The third is any question about an infant, toddler or child, which is paediatric territory, including any zinc-containing product intended for one.
The fourth is any gastrointestinal condition, any history of intestinal surgery, or any long term prescription, since zinc is described as interacting with several classes of medication in both directions and since absorption itself can be affected. The fifth is any specific worry about zinc status, which is established by testing interpreted alongside a full history rather than by matching yourself against a general description. This evidence review deliberately contains no symptom list, because self-matching against general symptoms misleads in both directions, producing unnecessary worry in some readers and false reassurance in others while something else goes uninvestigated. Our vitamin B12 review and our vitamin D review make the same handover on nutrients where testing is central.

The Bottom Line
How much zinc per day comes down to two commonly cited adult figures, roughly 11 milligrams for men and roughly 8 for women, with pregnancy near 11 and breastfeeding near 12. The sex split is a body size effect rather than a blood loss one, which is why, unlike iron, the figure for women does not fall after about age 51. Those figures are published by national health authorities, reviewed periodically, and worth confirming for your own age, sex and life stage rather than taken from any article.
The food answer has one outlier and a broad middle. Oysters sit far above everything else with published values that vary too widely to quote as a single number. Braised beef chuck is commonly cited near 7 milligrams for three ounces, then crab, lobster, pork, baked beans, dark poultry and pumpkin seeds cluster between roughly 2 and 3.5, with dairy, cashews, chickpeas and oats filling a long tail near 1. An ordinary mixed day reaches the reference figures without anyone aiming at them.
The cautions are where this page earns its keep. Phytate means the same milligrams do not land the same on a plant-forward plate, which is why reference publications commonly note that people eating no meat or seafood may need as much as roughly 50 percent more. The commonly cited 40 milligram ceiling counts food, fortification and supplements together and is set against copper status, which cannot be monitored at home. No absorption percentage appears anywhere above because none can honestly be given. If a supplement, a lozenge or a nasal product is in question, the next step is an appointment rather than a purchase, and the companion below is a sketching tool rather than an answer.
This evidence review is published for general education and reproduces commonly cited, approximate reference intakes and food composition figures for zinc. It is not medical, dietary or nutritional advice, it does not diagnose, treat or manage any condition, and reading it creates no clinician-patient relationship. Population reference intakes and upper intake levels are published by national health authorities, are reviewed and revised over time, and differ between countries, so the current figure for your own age, sex and life stage should be confirmed against the publishing authority rather than taken from this page. Every milligram value above is a rounded reference approximation rather than a measurement of any particular cut, tin, shell or box, and content varies with variety, species, brand, cut, fortification and preparation, which is why the panel on your own package is the figure that applies to you. The oyster figure is deliberately given as a range because published values differ too widely by species and preparation to state as one number, and no absorption percentage is quoted for any food or meal because published estimates vary too widely with the meal and with the eater’s own status. Nothing above recommends taking a zinc supplement, lozenge or nasal product, suggests an amount or duration for one, or identifies who should take one, and this evidence review takes no position on any use of zinc beyond ordinary food. No symptom list appears above, deliberately, since self-matching against general symptoms misleads in both directions. Anyone who is pregnant or breastfeeding, asking on behalf of an infant or child, living with a gastrointestinal condition or a history of intestinal surgery, taking regular medication, or worried about their own zinc status should take the question to a doctor, pharmacist or registered dietitian who knows the full history, since status is established by testing rather than by arithmetic.
Frequently asked questions
How much zinc per day do adults need?
The Recommended Dietary Allowances published by the Food and Nutrition Board of the National Academies are commonly cited at roughly 11 milligrams a day for men aged 19 and older and roughly 8 milligrams a day for women aged 19 and older. Pregnancy is commonly cited near 11 milligrams and breastfeeding near 12 milligrams for adults. These are population reference values that describe a group rather than a prescription for any individual, they are reviewed and revised over time, and they differ between countries. Confirm the current figure for your own age, sex and life stage against the publishing health authority rather than treating any article, this one included, as the live source.
Why is the zinc figure higher for men than for women?
The reason is body size rather than anything dramatic. Reference intakes for zinc are derived from the amount needed to replace the zinc the body loses each day, and those losses scale roughly with body size and lean mass, which is larger on average in men. That is a very different mechanism from iron, where the sex gap is driven by menstrual blood loss. It also explains a second difference between the two minerals: the zinc figure does not drop for women after about age 51, because nothing about the underlying loss changes at that point, while the commonly cited iron figure falls by more than half.
What is the upper limit for zinc?
The Tolerable Upper Intake Level commonly cited for zinc is roughly 40 milligrams a day for adults, with lower ceilings down the age table, near 34 milligrams for ages 14 to 18 and near 23 milligrams for ages 9 to 13. It counts food, fortified products and supplements together, and it is a boundary rather than a goal. The effect it is set against involves copper status, since sustained high zinc intakes are described as interfering with copper absorption. It also does not apply to anyone taking zinc under medical supervision for a diagnosed reason, which is one more sign that everything past ordinary food is clinical territory.
Which foods carry the most zinc?
Oysters sit far above everything else, with published figures for a three ounce serving running from roughly 30 milligrams upward depending on species and preparation, which is several times an adult reference intake in one serving. Below that the ranking is ordinary: braised beef chuck is commonly cited near 7 milligrams for three ounces, blue crab near 3.2, a pork loin chop and a half cup of baked beans near 2.9 each, dark poultry meat near 2.4, and an ounce of pumpkin seeds near 2.2. Dairy, cashews, chickpeas and oatmeal land nearer 1 to 1.7 milligrams a serving. Every figure here is a rounded reference approximation, and the panel on your own package is the only one describing what you bought.
Do vegetarians and vegans need more zinc?
Reference intake publications commonly note that people eating no meat or seafood may require as much as roughly 50 percent more zinc than the published figure, and the reason is phytate. Whole grains, legumes, nuts and seeds carry both the zinc and the compound that binds it in the gut, so the same milligram total on a plant-forward plate is described as delivering less. The published adjustment is a signal to pay attention rather than a target to hit exactly. Preparation helps, since soaking, sprouting, fermenting and leavened bread all reduce phytate to varying degrees, and anyone eating this way with a specific concern should raise it with a doctor or registered dietitian rather than adjusting on the strength of an article.
Why is zinc always discussed alongside copper?
Because the two compete, and the competition runs mainly in one direction. Sustained high zinc intakes are described as reducing copper absorption, through an effect on the intestinal proteins that handle both metals, which is why the commonly cited 40 milligram ceiling for zinc is set against copper status rather than against any immediate discomfort. The practical point for a food page is small, since ordinary meals do not reach that territory. It matters for anything concentrated, which is the reason a zinc supplement is a conversation for a clinician or pharmacist who can see the rest of the picture rather than a shelf decision.
Does the body store zinc the way it stores iron?
Not in any comparable way. There is no large, readily mobilised zinc store equivalent to the iron held in ferritin, and most of the body's zinc sits inside tissues doing structural and enzymatic work rather than waiting in reserve. Balance is instead maintained by adjusting how much is absorbed and how much is lost, mainly through the gut. The practical consequence is that zinc is described as a nutrient where regular intake matters more than occasional large amounts, which is a general principle about the mineral rather than a dosing instruction for anyone.
Should I take a zinc supplement?
This evidence review does not recommend any supplement, does not suggest an amount, and cannot tell anyone whether they need one. Three things make that the correct answer rather than a hedge. The commonly cited ceiling counts every source together, so a supplement lands on top of food and fortification rather than beside it. Sustained high intakes affect copper status, which is not something a reader can monitor at home. And zinc is described as interacting with several classes of medication in both directions, which is a pharmacist's territory. Anyone considering one should take the question to a doctor, pharmacist or registered dietitian who knows the full history.
What does a zinc percentage on a Nutrition Facts panel mean?
The percentage is calculated against a labeling Daily Value commonly cited at 11 milligrams for adults, which matches the commonly cited reference intake for adult men and sits above the figure for adult women. So a panel percentage reads about right for one group and slightly low for the other. A product showing 25 percent is supplying roughly 2.8 milligrams whoever is reading it. Zinc is not among the nutrients that must always be declared on the United States panel, so the line is present on some packages and absent on others, and labeling rules are set by the FDA and revised over time. Read the milligram figure where it appears and treat the percentage as a rough screen.

Hamza Hai is the editor of NourishMark. She holds an MBA and reviews the site's articles against our editorial standards, checking that every figure is labelled for what it is, that nothing is presented as verified fact without a source the reader can check, and that the writing stays useful to a non-specialist.

Dr. Shayaan Khan is the medical reviewer for NourishMark. He holds an MBBS from MGM Medical College, Navi Mumbai, and is the author of published research including a narrative review of postpartum anxiety and depression in Mental Health Science. He has taught physiology at university level. He reviews the site's health content for medical accuracy: that physiology and mechanisms are described correctly, that no claim is stated more strongly than the evidence behind it, and that anything specific to an individual reader is sent to that reader's own clinician.
Not medical advice. Dr. Khan reviews NourishMark's health content for medical accuracy. He is not a registered dietitian, he does not hold a United States practising licence, and he is not your doctor. His review does not make anything here medical advice. Always talk to a qualified health professional about your own situation, and never delay or stop care because of something you read here.