What's in this review
- What a Fiber Intake Calculator Actually Does
- The Daily Fiber Chart by Age, Sex and Life Stage
- The Calorie-Scaled Version of the Same Chart
- Why a Fiber Chart Needs Food-Level Detail, Not Just a Target
- Charting Fiber Sources Side by Side
- Building a Worked Day Against the Chart
- Reading Fiber on a Nutrition Facts Panel
- Why Fortified and Packaged Foods Break a Generic Chart
- Where a Fiber Supplement Fits a Calculator
- Common Mistakes When Using a Fiber Calculator
- Increasing Fiber Without Discomfort
- When a Fiber Target Should Come From a Clinician, Not a Chart
- Common Misunderstandings About Fiber Charts
- Why Two Fiber Calculators Can Disagree on the Same Reference Figure
- What This Page’s Companion Does Differently
- What a High-Fiber Day Does in General Terms
- Fiber and Water: Why the Tool Should Not Be Used Alone
- Dietary Fiber Versus Functional Fiber on a Label
- Children’s Fiber Charts Use a Different Scale
- Comparing a Fiber Calculator to a Food-Tracking App
- A Short Fiber-Forward Shopping List
- The Bottom Line
Short answer: A fiber intake calculator compares a rough tally of the fiber-carrying foods in a day against a commonly cited reference figure, generally near 25 grams a day for adult women and 38 grams for adult men under 50, easing to roughly 21 and 30 grams after 50. A daily fiber chart works the same way food by food, and the two are really the same underlying idea presented in two different formats. Both are arithmetic aids for noticing a gap, not measurements, and not a target for everyone, since some digestive conditions call for less fiber rather than more.
Searching for a fiber intake calculator usually means one thing: a number feels abstract until it is set against what is actually on the plate. Knowing that general guidance points toward roughly 25 to 38 grams a day does little on its own, because almost nobody carries a running gram count in their head through breakfast, lunch and dinner. A calculator and a daily fiber chart exist to close that gap between a guideline and a grocery list.
This evidence review explains how a fiber intake calculator is built, lays out the commonly cited daily fiber chart by age and sex, walks through a gram-per-serving reference table for everyday foods, and shows a worked example of totaling a day. It also covers where such tools fall short, since arithmetic cannot know your actual portion sizes or account for a digestive condition that calls for a different approach. For the fuller explanation of soluble versus insoluble fiber and why most people fall short, see our fiber intake evidence review; for a reference across every major nutrient, see our daily nutrient intake reference. Build your own day in the companion below. Everything here is general education and commonly cited approximation, not medical or dietary advice.
Key takeaways
- A fiber intake calculator compares your entered foods against a reference figure commonly cited near 25 g a day for adult women and 38 g for adult men under 50, easing to about 21 and 30 g after 50.
- A daily fiber chart works food by food, using typical grams-per-serving figures for legumes, whole grains, fruit, vegetables, nuts and seeds, with legumes carrying the most per serving.
- The same guidance can also be expressed as roughly 14 grams of fiber for every 1,000 calories eaten, which is why a larger or more active eater is generally guided toward a higher gram figure.
- Any calculator or chart is an arithmetic sketch, not a measurement. Fortified and packaged foods vary by brand, so the panel on your own product is the more reliable figure for that item.
- More is not automatically better. Increase fiber gradually with more fluid, and anyone with a digestive condition should get their own target from a doctor or registered dietitian rather than a general calculator.
What a Fiber Intake Calculator Actually Does
A fiber intake calculator is a small piece of arithmetic wearing a friendly interface. It starts from a reference figure, the commonly cited daily guidance for your age and sex, and then adds up an estimate of the fiber you are eating from the foods you enter, using typical grams-per-serving figures published for common items. The output is a comparison: your rough total against the reference figure, expressed as a gap or a percentage.
What it cannot do is measure anything. It does not know the variety of apple you ate, whether your lentils were drained or not, or how your bread brand’s fiber content compares to the generic figure in its database. That limitation is not a flaw specific to any one tool; it is true of every fiber calculator and every printed fiber chart, because food composition genuinely varies and no calculator can see your actual plate.
What a calculator is good for is exactly what arithmetic is good for: turning a vague sense of “I probably eat enough fiber” or “I probably don’t” into a rough, checkable number, and surfacing which single meal or food swap would close most of a gap. That is a more useful output than it sounds, because most people who fall short of general fiber guidance are not short everywhere at once; they are typically missing one or two fiber-dense categories entirely, and a calculator makes that specific gap visible in a way that a vague sense of “eating healthy” cannot.
The Daily Fiber Chart by Age, Sex and Life Stage
The reference figures behind any fiber chart come from Adequate Intake values set by nutrition authorities, and they step down by life stage rather than sitting at one flat number. The table below lists the commonly cited figures in grams per day.
| Group | Fiber, g per day |
|---|---|
| Children 1 to 3 years | 19 |
| Children 4 to 8 years | 25 |
| Boys 9 to 13 years | 31 |
| Girls 9 to 13 years | 26 |
| Boys 14 to 18 years | 38 |
| Girls 14 to 18 years | 26 |
| Men 19 to 50 years | 38 |
| Women 19 to 50 years | 25 |
| Men 51 years and older | 30 |
| Women 51 years and older | 21 |
| Pregnancy | 28 |
| Breastfeeding | 29 |
Two features stand out. Teenage boys are already cited at the adult male figure by age 14, while girls settle closer to the adult female figure a little earlier. And every adult figure falls after 50, which tracks a general decline in calorie intake with age rather than a lower need for fiber itself. Treat this table as commonly cited reference figures and confirm your own row if a clinician has reason to set a different target for you.
The Calorie-Scaled Version of the Same Chart
A second common way to express the same guidance scales with how much you actually eat: roughly 14 grams of fiber for every 1,000 calories in your diet. Someone eating around 2,000 calories a day lands near 28 grams by this method, and someone eating 2,500 calories lands near 35, which is part of why a larger or more active eater is generally guided toward more fiber than the flat age-based figure alone suggests.
The two methods are two views of the same underlying idea rather than competing rules, and for an eater whose calorie intake sits close to average for their age and sex, they tend to land in a similar place. A fiber intake calculator built only around age and sex is not wrong, just less precise for anyone eating well above or below a typical calorie level for their group.
Why a Fiber Chart Needs Food-Level Detail, Not Just a Target
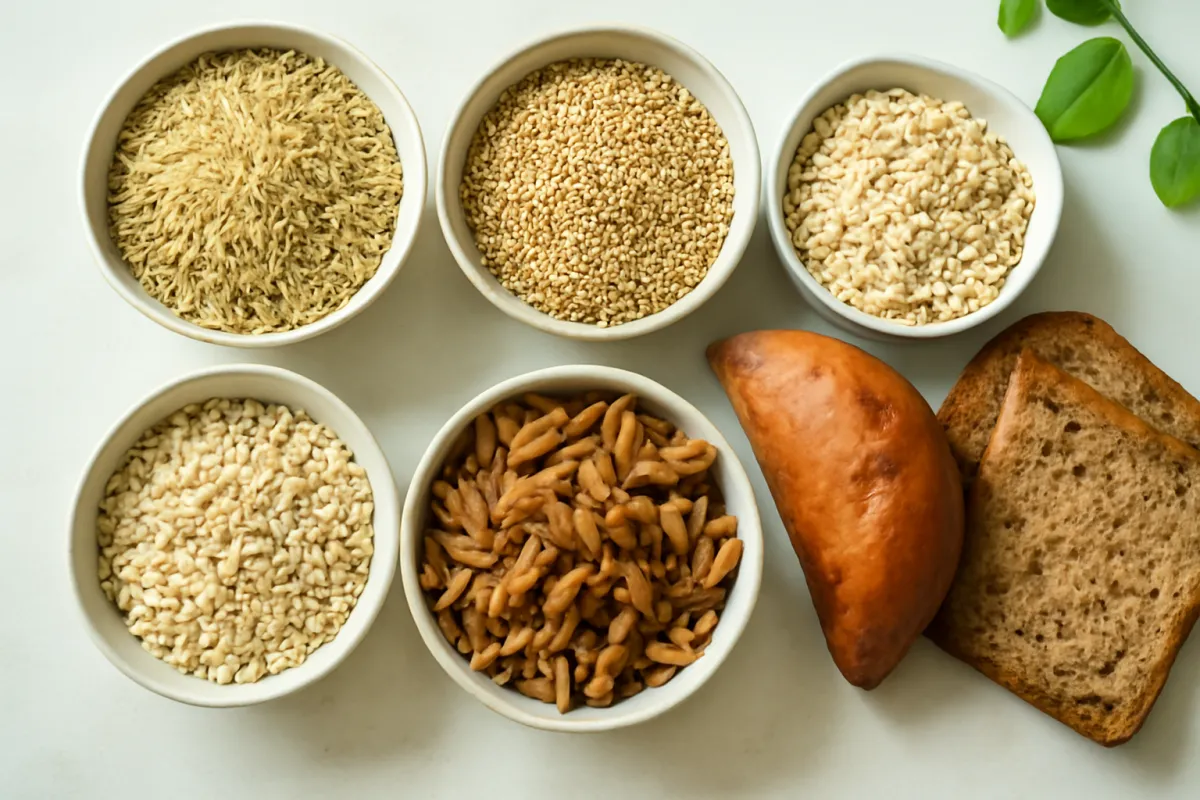
A single gram target tells you where to land, not how to get there, and that is the gap a food-level fiber chart fills. Knowing that an adult woman is generally guided toward roughly 25 grams a day says nothing about whether a given breakfast, lunch and dinner gets her there, and most people have never actually added up a full day’s fiber before encountering a chart like this one. The table below lists commonly cited fiber figures for ordinary servings, useful for sketching a day rather than for any single precise reading.
| Food | Typical serving | Fiber, roughly |
|---|---|---|
| Lentils, cooked | 1 cup | ~15 g |
| Black beans, cooked | 1 cup | ~15 g |
| Split peas, cooked | 1 cup | ~16 g |
| Chickpeas, cooked | 1 cup | ~12 g |
| Raspberries | 1 cup | ~8 g |
| Pear, with skin | 1 medium | ~6 g |
| Apple, with skin | 1 medium | ~4 g |
| Avocado | 1/2 fruit | ~5 g |
| Broccoli, cooked | 1 cup | ~5 g |
| Sweet potato, with skin | 1 medium | ~4 g |
| Oats, dry | 1/2 cup | ~4 g |
| Chia seeds | 2 tbsp | ~10 g |
| Almonds | 1 oz | ~3.5 g |
| Whole wheat bread | 1 slice | ~2 g |
| White bread | 1 slice | ~0.8 g |
| Brown rice, cooked | 1 cup | ~3.5 g |
| White rice, cooked | 1 cup | ~0.6 g |
Legumes dominate the top of the chart by a wide margin, chia seeds punch well above their size, and the refined-versus-whole comparisons for bread and rice show how much a simple swap moves the total. Every figure is a rounded, commonly cited approximation that shifts with variety and preparation, so the panel on a packaged product remains the more reliable number for that item.
Charting Fiber Sources Side by Side
Fiber per common serving
Grams per typical portion, against adult reference figures commonly cited near 21 to 38 g a day. Illustrative approximations that vary by variety and preparation.
Bars scale to split peas at 100 percent. Commonly cited approximations that vary with variety and preparation, not personal targets.
Legumes carry the chart because they combine a dense fiber figure with an unusually large standard serving. A single half-cup side of lentils already rivals two slices of whole wheat bread, which is the arithmetic reason legume-forward meals close a fiber gap faster than almost any other category.
Building a Worked Day Against the Chart
Here is one illustrative day assembled from the table above, built against the commonly cited 25 gram figure for women aged 19 to 50. It is an example of the arithmetic a fiber calculator performs, not a meal plan or a claim about any health outcome.
| Meal | Foods | Fiber |
|---|---|---|
| Breakfast | 1/2 cup dry oats (~4 g), 1 tbsp chia seeds (~5 g) | ~9 g |
| Lunch | 1 cup cooked lentils (~15 g), spinach salad | ~15 g |
| Snack | 1 medium apple with skin | ~4 g |
| Dinner | 1 cup cooked broccoli (~5 g), brown rice (~3.5 g) | ~8.5 g |
| Total | ~36.5 g |
This illustrative day clears the 25 gram figure with room to spare, largely on the strength of one legume-based lunch. That pattern repeats across most worked examples on this site: one fiber-forward meal does more work than five scattered small additions, which is a useful thing to notice before assuming a target requires constant vigilance.
Where an illustrative 36.5 g day comes from
Shares of the worked day above, by meal, against the commonly cited 25 g figure for women aged 19 to 50. Reference approximations, not a meal plan.
Segments sum to 100 percent of the illustrative day. Grams on the plate rather than a measured absorption figure, and approximations rather than a personal target.
Reading Fiber on a Nutrition Facts Panel
Fiber is a mandatory line on the United States Nutrition Facts panel, declared in grams per serving along with a percent Daily Value calculated against a reference commonly cited at 28 grams. That reference sits above the figure for adult women and close to the figure for adult men, so a panel percentage reads a little conservative for most women and close to accurate for most men.
The practical habit is the same one that applies across every nutrient on this site: read the gram figure first and treat the percentage as a rough screen, because grams are absolute and addable while a percentage depends on a denominator that may not match your own reference figure. Our nutrition label walkthrough covers the panel more broadly.
Why Fortified and Packaged Foods Break a Generic Chart
Fiber-fortified cereals, bars and breads are the one category where a generic fiber chart genuinely cannot help, because the added fiber is a manufacturer’s formulation choice rather than a property of the base grain. Two boxes of cereal that look similar on the shelf can differ by several grams of fiber per serving, and no chart built from average figures can predict which is which.
This is the same pattern documented on this site’s iron and other mineral pages: a generic table is a starting point, and the label on the specific product in your hand is the figure that actually applies to it. A fiber intake calculator that lets you enter your own panel figure for fortified items, rather than forcing a generic one, is doing something a flat printed chart cannot.
Where a Fiber Supplement Fits a Calculator
A fiber supplement, such as psyllium husk, raises a reasonable question for anyone watching a calculator total: does adding a scoop count the same as adding a food? Numerically, yes, a supplement’s labeled fiber grams add to the same running total as food does. Practically, nutrition references generally describe a food-first approach as preferable, since whole foods deliver fiber alongside vitamins, minerals, and other components that an isolated supplement does not carry.
That does not make a supplement the wrong choice for everyone. It can be a reasonable way to close a persistent gap for some people, particularly where food-based changes have not been enough. This evidence review and its companion calculator do not recommend a brand, a dose, or a route, because whether a supplement suits your situation depends on your overall diet, your digestion, and any medications you take, all of which belong in a conversation with a doctor or pharmacist rather than in a calculator’s output.
Common Mistakes When Using a Fiber Calculator
The first mistake is treating a one-day calculator total as a verdict on overall eating. A single day is noisy, and the useful signal from any fiber chart is a pattern across a week, not a pass-or-fail grade on one Tuesday. The second is forgetting that fortified products need their own panel figure rather than a generic database value, which can silently overstate or understate a packaged item by several grams.
The third mistake is chasing the number upward without raising fluid intake alongside it, which is the most common cause of the gas and bloating that make people abandon a fiber increase altogether. The fourth is assuming a calculator built for general healthy adults applies the same way to someone with a diagnosed digestive condition, when the honest answer is that it does not, and that situation calls for individualized guidance rather than a generic target.
Increasing Fiber Without Discomfort
The commonly repeated rule for raising a fiber total is gradual rather than immediate: add one fiber-rich food at a time over a couple of weeks, and increase fluid intake as you do, since fiber works partly by absorbing water in the digestive tract. A calculator can show how far a single swap, such as replacing white rice with brown rice or adding a half cup of beans to a soup, moves the daily total, which makes the gradual approach concrete rather than vague.
Spreading fiber-rich foods across meals rather than loading them into one sitting is the other half of the comfort equation, and it is also the arithmetic reason the worked day above distributes fiber across breakfast, lunch and dinner rather than putting the whole target into one meal.

When a Fiber Target Should Come From a Clinician, Not a Chart
Several situations call for an individualized fiber target rather than the general chart on this page. Anyone with inflammatory bowel disease, irritable bowel syndrome, a history of bowel obstruction, or a recent digestive surgery should get a specific figure, sometimes lower rather than higher, from their own clinician or registered dietitian. Anyone experiencing persistent bloating, pain, or a change in bowel habits should raise it with a doctor rather than adjusting fiber intake on their own in response to a calculator result.
Pregnancy and breastfeeding carry their own reference figures, noted in the table above, and any specific question for those life stages belongs with the clinician providing that care. None of that is a reason to avoid a general fiber calculator; it is a reason to treat its output as a starting conversation rather than a final answer.
Common Misunderstandings About Fiber Charts
The first misunderstanding is that every gram of fiber behaves the same way once eaten, when soluble and insoluble fiber do meaningfully different things in the body even though most simple charts total them together. The second is assuming a chart figure for a generic food matches the specific item in your kitchen exactly, when variety, ripeness and preparation all shift the real number somewhat.
The third is assuming more fiber is unambiguously better once a target is hit, when the honest picture is that benefits generally plateau and digestive comfort becomes the more relevant consideration well above the guidance. The fourth is using a fiber calculator as a stand-in for medical advice about a digestive condition, which it was never built to provide.
Why Two Fiber Calculators Can Disagree on the Same Reference Figure
Beyond differing food databases, calculators can also disagree because they anchor to different reference figures in the first place. Some tools use a single flat adult figure for simplicity, commonly 25 or 28 grams, rather than splitting by sex and age the way the table earlier on this page does. Others default to the calorie-scaled 14-grams-per-1,000-calories rule and ask for a calorie figure up front instead of an age and sex selection.
Neither approach is incorrect; they are different simplifications of the same underlying Adequate Intake data. The practical takeaway is to check which reference figure a tool is using before comparing its percentage output to another tool’s, since a result read as “72 percent of target” means something different depending on whether the denominator is 25, 28, or a personalized calorie-scaled figure. The companion on this page states its reference figure explicitly for exactly this reason.
What This Page’s Companion Does Differently
The companion below is built around the age-and-sex reference table rather than a single flat figure, and it lets you enter servings of the food categories that carry the most fiber, legumes, whole grains, fruit with skin, vegetables, nuts and seeds, rather than requiring a long food-by-food log. That design trades precision for speed, which is the same trade-off every quick fiber calculator makes, stated here rather than left implicit.
It also separates out fortified products as their own entry, since those are the one category where a generic chart figure can be meaningfully wrong in either direction, letting you type in the number from your own cereal or bar panel instead of guessing. The result is still an estimate, consistent with every caveat on this page, built for sketching a pattern rather than for clinical tracking.
What a High-Fiber Day Does in General Terms
A fiber intake calculator answers how much, not why it matters, and a brief general-terms answer belongs alongside the arithmetic. Fiber is generally described as supporting regularity by adding bulk and helping move material through the digestive tract, a role most associated with the insoluble type found in whole grains and vegetable skins. Soluble fiber, the kind that forms a gel, is more associated in general evidence with steadier blood sugar responses and with modest reductions in LDL cholesterol when eaten consistently as part of an overall pattern.
Fiber-rich foods also tend to be filling relative to their calorie content, since fiber adds volume and slows digestion, which is commonly discussed as one general mechanism behind appetite regulation. None of this is a guarantee for any individual, a treatment claim, or a reason to treat a fiber calculator as a health intervention rather than a tracking aid. These are population-level associations drawn from general nutrition evidence, and any specific health goal is better pursued with a doctor or registered dietitian who can weigh fiber alongside the rest of a person’s situation.
Fiber and Water: Why the Tool Should Not Be Used Alone
A fiber calculator that only tracks grams is missing half of the comfort equation, because fiber’s bulking and gel-forming effects depend on water being available to work with. Soluble fiber needs fluid to form the gel associated with its effects, and insoluble fiber can make stools harder rather than softer if fluid intake does not rise alongside a fiber increase, which is the opposite of what most people expect when they add more fiber to help with regularity.
The commonly cited practical pairing is straightforward: as a fiber total rises toward the reference figure, fluid intake is generally encouraged to rise with it, without a single fixed extra-ounces figure that applies to everyone. Our hydration guide covers daily fluid needs in more depth, and reading the two pages together gives a more complete picture than either number alone, which is a limitation worth naming honestly rather than leaving a calculator user to discover it through discomfort.
Dietary Fiber Versus Functional Fiber on a Label
Not every gram on a fiber line comes from the same place, and a nutrition label quietly distinguishes between them even though a fiber calculator usually cannot. Dietary fiber is the naturally occurring fiber intact in a whole food, the kind in beans, whole grains, fruit and vegetables. Functional or isolated fiber refers to fiber extracted or manufactured and added to a product, such as inulin, polydextrose or added cellulose, which food regulators require to demonstrate a beneficial physiological effect before it can be counted on the fiber line at all.
The practical consequence is that two products showing an identical gram figure are not necessarily equivalent, since one might carry its fiber intact inside whole food structure while the other carries an added isolate blended in primarily to raise the number on the panel. This evidence review does not rate one source as superior in a blanket way, since isolated fibers are deliberately reviewed before approval, but it is a reason that a chart built entirely from whole foods will not always predict what a heavily engineered packaged product delivers. The ingredient list, read alongside the fiber line, tells you which situation you are looking at.
Children’s Fiber Charts Use a Different Scale
The age-based rows at the top of the reference table deserve their own note, because they are frequently misapplied. Children are not simply smaller adults on a fiber chart; their Adequate Intake figures are scaled to typical calorie needs for their age, which is why a four-year-old’s commonly cited figure sits near 25 grams, not far under the 25 grams cited for an adult woman, despite eating far fewer total calories.
That scaling matters because a parent using an adult-oriented fiber calculator on a child’s intake, or assuming a child simply needs a fraction of the adult number, can land on a misleading figure in either direction. Pediatric nutrition, including any specific concern about a child’s fiber intake, constipation, or diet pattern, is better addressed with a pediatrician or pediatric dietitian than by stretching a general adult-facing tool to fit, since growth needs and portion realities differ enough from the adult picture that this evidence review does not attempt to cover them in depth here.
Comparing a Fiber Calculator to a Food-Tracking App
Readers who already use a general food-tracking app sometimes wonder why its fiber total differs from a dedicated fiber calculator or chart. The usual explanation is the underlying food database rather than any error in either tool. General tracking apps draw on large, crowd-maintained food databases where entries for the same food can carry different fiber figures depending on who logged it and from which source, while a chart built for one article draws from a narrower, more curated set of reference figures.
Neither is more correct in an absolute sense; both are approximations built from different data sources, and small differences between two tools measuring the same meal are normal rather than a sign that one is broken. The more useful habit than chasing agreement between tools is picking one source, using it consistently, and reading its output as a trend over days and weeks rather than a precise daily score.
A Short Fiber-Forward Shopping List
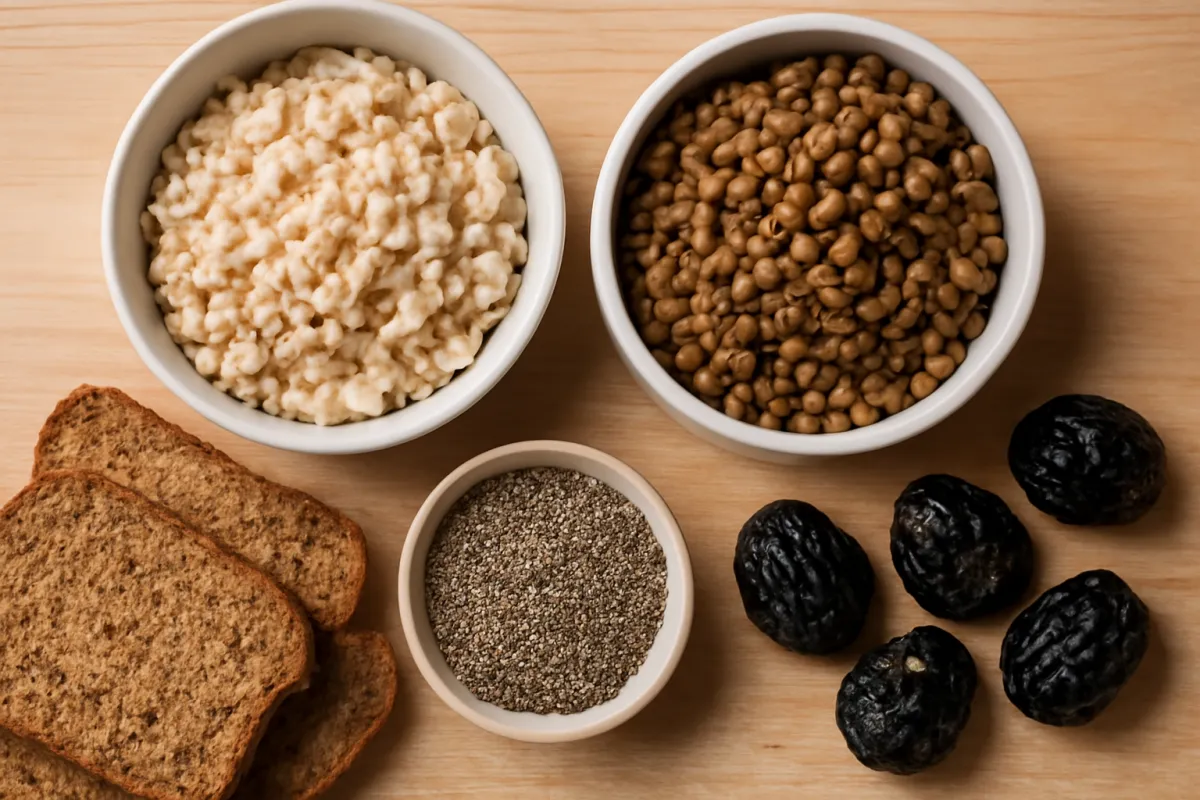
A short list beats an exhaustive one for actually changing what ends up on the plate. For the top of the chart, dried or canned lentils, black beans, chickpeas and split peas, since all four keep well and carry more fiber per dollar than almost anything else in an ordinary shop. Chia seeds and ground flaxseed are the compact additions that work stirred into oatmeal, yogurt or a smoothie without changing a recipe much.
For the produce aisle, apples and pears eaten with the skin, raspberries, avocado and broccoli cover a meaningful share of a day without requiring any special preparation. For the grain aisle, a plain switch from white rice or white bread to the brown or whole-grain version adds several grams with no other change to the meal at all. That basket overlaps closely with the iron-forward and magnesium-forward lists elsewhere on this site, so it folds into a single trip rather than a separate one, consistent with our grocery list method.
The Bottom Line
A fiber intake calculator and a daily fiber chart are the same underlying idea in two formats: a commonly cited reference figure, near 25 grams a day for adult women and 38 for adult men under 50 and lower after 50, set against a rough tally of what is actually on the plate. Legumes, chia seeds, whole grains, fruit with the skin, and vegetables carry the load, and a single fiber-forward meal typically does more work toward the target than several scattered small additions.
Both tools are arithmetic aids for noticing a gap, not measurements of what you actually absorbed, and fortified or packaged foods need their own label figure rather than a generic chart value. Increase gradually, add fluid as you go, and treat any digestive condition, sudden symptom, or specific life-stage question as a reason to talk to a doctor or registered dietitian rather than lean further on a calculator. Build your own version in the companion below.
This evidence review and its companion calculator are published for general education and reproduce commonly cited, approximate reference intakes and food composition figures for fiber. They are not medical, dietary or nutritional advice, do not diagnose, treat or manage any condition, and reading or using them creates no clinician-patient relationship. Population reference intakes are published by national health authorities, are reviewed and revised over time, and differ between countries, so the current figure for your own age, sex and life stage should be confirmed against the publishing authority rather than taken from this page. Every gram figure above is a rounded reference approximation rather than a measurement of any particular food in your kitchen, and content varies with variety, ripeness, brand, fortification and preparation, which is why the panel on your own package is the figure that applies to you. The calculator on this page performs simple arithmetic on the figures you enter; it does not know your actual portions and cannot substitute for tracking done with a food scale or a registered dietitian’s guidance. Nothing here recommends a fiber supplement, a specific increase, or a target different from general population guidance for any individual. Anyone with inflammatory bowel disease, irritable bowel syndrome, a history of bowel obstruction or digestive surgery, persistent digestive symptoms, or a question specific to pregnancy or breastfeeding should take their own fiber target to a doctor or registered dietitian rather than to this page or its calculator.
Frequently asked questions
How does a fiber intake calculator actually work?
A fiber intake calculator takes a reference figure for your age and sex, commonly cited near 25 grams a day for adult women and 38 grams for adult men under 50, and compares it against a rough tally of the fiber-carrying foods you enter, using typical grams-per-serving figures for common items like beans, whole grains, fruit and vegetables. The output is arithmetic, not a measurement, since it cannot know your actual portions, varieties, or preparation. Treat any such tool, including the one on this page, as a sketch for reasoning about a day rather than a precise reading of what you ate.
What is a good daily fiber chart to follow by age?
The commonly cited reference figures step down by life stage rather than following one flat number. Adult women under 50 are generally cited near 25 grams and adult men under 50 near 38 grams, both easing to roughly 21 and 30 grams after 50 as calorie needs tend to fall. Teenagers are cited close to the adult figures already, while young children are cited lower, scaled to a smaller calorie intake. These are population reference values rather than personal prescriptions, and the right figure for any one person is worth confirming with a doctor or registered dietitian.
Why do fiber charts differ between a general and a 1,000-calorie rule?
Most published fiber guidance is expressed two ways that describe the same underlying idea. The first is a fixed gram figure by age and sex, the kind seen on a typical daily fiber chart. The second is a calorie-scaled rule, commonly cited as roughly 14 grams of fiber for every 1,000 calories eaten, which is the method behind why larger or more active eaters are generally guided toward a higher gram figure. The two methods tend to agree reasonably well for an average eater, and a chart that only shows one of them is not wrong, just incomplete.
Is more fiber from a tracker always better?
No, and a fiber tracker that only rewards a higher number can mislead. For most healthy adults, going somewhat above the general guidance from ordinary food is not generally treated as a concern, but increasing fiber very quickly can cause gas, bloating and cramping if fluid intake does not rise with it. Some people with specific digestive conditions, including a history of bowel obstruction, are specifically advised to limit fiber rather than maximize it. A calculator can show a gap to the guidance; it cannot tell you whether more is right for your own digestion.
Does a fiber counter chart account for soluble versus insoluble fiber?
Most simple fiber charts and calculators, including the one on this page, total fiber as one combined gram figure rather than splitting it into soluble and insoluble types, because food composition data for the split is less consistently available than the combined total. Both types matter for different reasons, soluble fiber for its gel-forming effects and insoluble fiber for bulk and regularity, and a varied diet across legumes, whole grains, fruit, vegetables, nuts and seeds naturally supplies both without having to track them separately.
How accurate are the gram-per-serving figures in a fiber chart?
They are commonly cited approximations, not measurements of any specific food on your counter. Fiber content varies with variety, ripeness, cooking method, and brand, especially for packaged and fortified products where the Nutrition Facts panel is the only figure that describes what you actually bought. A chart or calculator is useful for noticing a gap or a rough pattern across a day, and the panel on your own food is always the more reliable number for that particular item.
Can a fiber calculator replace a nutrition label?
No. A fiber calculator or chart works from typical reference figures for common foods and is meant for rough day-level reasoning, while a Nutrition Facts panel describes the specific product in front of you, including any fortification, which can push a packaged food's fiber well above or below a generic chart figure. The two are complementary: use a chart to sketch a pattern and the panel to check an individual product, especially a cereal, bread or bar where fortification varies widely by brand.
Should I use a fiber calculator if I have a digestive condition?
This evidence review and its companion calculator are general educational tools and are not built for, or validated against, any specific digestive condition. Conditions such as inflammatory bowel disease, irritable bowel syndrome, diverticulitis flares, or a history of bowel obstruction can call for a different approach to fiber, sometimes less rather than more, and that approach should come from a doctor or registered dietitian who knows your history rather than from a general calculator.

Hamza Hai is the editor of NourishMark. She holds an MBA and reviews the site's articles against our editorial standards, checking that every figure is labelled for what it is, that nothing is presented as verified fact without a source the reader can check, and that the writing stays useful to a non-specialist.

Dr. Shayaan Khan is the medical reviewer for NourishMark. He holds an MBBS from MGM Medical College, Navi Mumbai, and is the author of published research including a narrative review of postpartum anxiety and depression in Mental Health Science. He has taught physiology at university level. He reviews the site's health content for medical accuracy: that physiology and mechanisms are described correctly, that no claim is stated more strongly than the evidence behind it, and that anything specific to an individual reader is sent to that reader's own clinician.
Not medical advice. Dr. Khan reviews NourishMark's health content for medical accuracy. He is not a registered dietitian, he does not hold a United States practising licence, and he is not your doctor. His review does not make anything here medical advice. Always talk to a qualified health professional about your own situation, and never delay or stop care because of something you read here.