What's in this review
- How Much Vitamin C Per Day? The Direct Answer
- Vitamin C Recommended Daily Intake by Age, Sex and Life Stage
- How Much Vitamin C Per Day for a Woman
- How Much Vitamin C Per Day for a Man
- Why the Two Adult Figures Differ at All
- Pregnancy and Breastfeeding Carry Separate Figures
- Infants, Children and Teenagers
- The Commonly Cited Addition for People Who Smoke
- Vitamin C Daily Dose: Why an Intake Figure Is Not a Dose
- EAR, RDA, AI and UL: Four Numbers, Four Questions
- Why the Figure Is a Reference Range and Not a Target
- Where the Adult Figure Came From
- The 2,000 mg Upper Limit Is a Boundary, Not a Goal
- Why This Page Quotes No Absorption Percentage
- Food Sources of Vitamin C: A Reference Table
- Which Foods Carry the Most per Serving
- Citrus Is Not the Only Source
- Why the Same Food Gives a Different Answer Twice
- Cooking, Water and Heat
- Storage, Cutting and Holding Warm
- Frozen, Canned and Juiced
- Fortified Products and the Panel on Your Own Package
- Vitamin C and Plant Iron at the Same Meal
- The 90 mg Daily Value on a Nutrition Facts Panel
- An Illustrative Day That Reaches 227 mg
- What a Supplement Facts Panel Tells You
- Why This Page Does Not Say Who Should Supplement
- Common Mistakes When Counting Vitamin C
- When the Question Belongs With a Clinician
- The Bottom Line
Short answer: The commonly cited Recommended Dietary Allowance for vitamin C is roughly 90 milligrams a day for men aged 19 and older and roughly 75 milligrams for women, with about 85 milligrams in pregnancy, about 120 milligrams while breastfeeding, and an addition of about 35 milligrams described for people who smoke. The commonly cited Tolerable Upper Intake Level for adults is about 2,000 milligrams a day. These are population reference values, not personal targets.
How much vitamin C per day has a short published answer and a longer honest one. The short version is that the recommended daily intake figures commonly cited for adults, published as Recommended Dietary Allowances, are roughly 90 milligrams a day for men and roughly 75 milligrams a day for women, with separate rows for pregnancy, breastfeeding, every childhood age band, and an addition described for people who smoke. The longer version is that those figures are population reference values rather than personal quotas, that they are periodically reviewed and revised by the bodies that publish them, and that the milligram content of the foods carrying them moves considerably with variety, ripeness, storage and cooking.
This evidence review works through both halves. It sets out the reference figures by age, sex and life stage, explains what an RDA and a Tolerable Upper Intake Level each mean and what neither of them means, describes where the adult figure came from, and then turns to food: which everyday items carry the most, why the same item can give a different answer twice, and what cooking and storage do to the number. The wider table sits in our daily nutrient intake reference, and you can sketch a rough day in the companion below. Everything here is general education describing approximate published figures. It is not medical or dietary advice, it makes no claim that vitamin C prevents or treats anything, and it does not tell anyone whether to take a supplement.
Key takeaways
- The commonly cited recommended daily intake for adults is roughly 90 mg a day for men aged 19 and older and roughly 75 mg for women aged 19 and older, with roughly 85 mg in pregnancy, roughly 120 mg while breastfeeding, and an addition of roughly 35 mg described for people who smoke.
- An RDA is a population reference value carrying a deliberate margin above the average requirement. It is not a personal target, and a day below it is not a finding about anyone.
- The commonly cited Tolerable Upper Intake Level of roughly 2,000 mg a day for adults is a boundary rather than a goal, it counts every source together, and ordinary food does not approach it.
- Food figures on this page are typical ranges rather than measurements. Half a cup of raw red bell pepper is commonly cited around 80 to 100 mg and a medium orange around 60 to 80 mg, and both move with variety, ripeness, storage and cooking. The panel on your own package is the figure that describes what you bought.
- Ascorbic acid is heat sensitive and water soluble, so how a food is stored, cut and cooked changes what reaches the plate. No retention or absorption percentage is quoted here, because published estimates vary too widely to state as fact.
How Much Vitamin C Per Day? The Direct Answer
For healthy adults, the commonly cited daily figures are roughly 90 milligrams for men aged 19 and older and roughly 75 milligrams for women aged 19 and older. Those are Recommended Dietary Allowances published by the Food and Nutrition Board of the National Academies as part of the Dietary Reference Intakes, and most reference tables print them for the whole adult range without a further split by age.
Two cautions belong with that answer before any arithmetic is built on it. The first is that reference intakes are published by national health authorities, are reviewed periodically, and do get revised, so the current figure for your specific age, sex and life stage should be confirmed against the publishing body rather than against an article. The second is definitional: an RDA is a population reference designed to cover the requirement of nearly all healthy people in a group. It is set with a margin above the average need on purpose. It is not a personal quota and not a threshold where anything happens on the wrong side of it.
The rest of this evidence review is mostly about the second half of the question, which is what those figures mean when you put them against a plate. Set your own row in the companion below and the arithmetic in each section runs against it.
Vitamin C Recommended Daily Intake by Age, Sex and Life Stage
The full reference table runs from infancy through adulthood, and it is worth seeing in one place, because the childhood figures are considerably smaller than most people assume and the breastfeeding figure is considerably larger. Infant values are published as Adequate Intakes rather than Recommended Dietary Allowances, a distinction the section on the four DRI terms below explains.
| Group | Vitamin C, commonly cited, mg per day |
|---|---|
| Infants 0 to 6 months | ~40 (Adequate Intake) |
| Infants 7 to 12 months | ~50 (Adequate Intake) |
| Children 1 to 3 years | ~15 |
| Children 4 to 8 years | ~25 |
| Children 9 to 13 years | ~45 |
| Boys 14 to 18 years | ~75 |
| Girls 14 to 18 years | ~65 |
| Men 19 and older | ~90 |
| Women 19 and older | ~75 |
| Pregnancy, adult | ~85 |
| Pregnancy, 14 to 18 | ~80 |
| Breastfeeding, adult | ~120 |
| Breastfeeding, 14 to 18 | ~115 |
| People who smoke | add roughly 35 to the figure above |
Read down the column and the shape is straightforward. The figures climb with body size through childhood, arrive near adult values in the mid teens, and then stop moving with age entirely, which is unusual on a reference table. Only life stage moves the adult rows after that. The whole range from a toddler to a breastfeeding adult spans a factor of eight, which is small compared with the spread on nutrients like iron. Every value above is a rounded approximation of a published reference value, subject to revision, and paediatric figures in particular belong with a child’s own clinician rather than with a table on a website.

How Much Vitamin C Per Day for a Woman
Asked specifically about women, the commonly cited answer is roughly 75 milligrams a day for women aged 19 and older, and unlike several other nutrients that figure does not step down or up again later in life. A woman of 25 and a woman of 70 are given the same row. That is worth stating plainly, because readers arriving from an iron or calcium page reasonably expect an age split and there is not one here.
What does move the figure is life stage rather than age. Pregnancy is commonly cited near 85 milligrams, breastfeeding near 120, and girls aged 14 to 18 near 65. The addition of roughly 35 milligrams described for people who smoke applies on top of whichever of those rows is in play, which is why a woman who smokes is commonly described against a figure near 110 rather than 75.
The practical consequence of a figure this size is that it sits within reach of a single ordinary serving of several common foods, which the food sections below set out in detail. That does not make it a target to hit precisely. It makes it a benchmark for reasoning about a week of eating. Select your row in the companion below to see how a sketched day of food reads against it, remembering that the tool is an arithmetic sketch rather than an assessment of anyone.
How Much Vitamin C Per Day for a Man
For men aged 19 and older the commonly cited figure is roughly 90 milligrams a day, again with no further split by age across the adult range. Boys aged 14 to 18 are commonly cited near 75 milligrams, which is the same number printed for adult women, and the step up to 90 happens at the boundary into the adult band rather than gradually.
As with the female rows, the smoking addition of roughly 35 milligrams applies on top, giving a commonly cited figure near 125 milligrams for men who smoke. There are no pregnancy or lactation rows to complicate the picture, so the male side of the table is the simpler one: two numbers across the teenage and adult range, plus one adjustment.
The fifteen milligram gap between the adult male and adult female figures is small in absolute terms, roughly the amount in a medium tomato by the typical ranges below, and it does not describe a difference in how the vitamin works. The next section explains what the split does and does not represent. Both figures are population reference values published for groups, and neither is a prescription for the person reading them.
Why the Two Adult Figures Differ at All
The commonly given explanation for the split between roughly 90 and roughly 75 milligrams is body size rather than biology specific to sex. Reference intakes for many nutrients are scaled from reference body weights, and the smaller average reference weight used for adult women produces a proportionally smaller figure. Nothing in the published reasoning describes the vitamin behaving differently, and the two figures are close enough that the distinction rarely changes any practical conclusion.
That has a useful implication for reading the table. Someone whose own body size sits well away from the reference weight used to derive their row is not thereby outside the reference intake, because the margin built into an RDA is wide relative to a fifteen milligram gap. Reference values are constructed to cover almost everyone in a group precisely so that individual variation inside the group does not require its own number.
It also explains why the gap survives at every adult age while other nutrients split and re-merge. The iron figure for women falls back to the male figure after roughly age 51 because the underlying driver, blood loss, stops, and our iron reference works through that in detail. Vitamin C has no equivalent driver, so its split is stable and small. These are descriptions of how published values were derived, not claims about any individual’s requirement.
Pregnancy and Breastfeeding Carry Separate Figures
Two rows sit apart from the general adult figures. Pregnancy in adults is commonly cited near 85 milligrams a day, roughly ten milligrams above the general adult female figure, and breastfeeding near 120 milligrams, which is the largest value anywhere on the vitamin C table. The lactation figure is the one that moves most, and it is commonly explained by the amount described as passing into breast milk rather than by any change in the parent’s own requirement.
The teenage versions of both rows are commonly cited slightly lower, near 80 and 115 milligrams, tracking the lower teen baseline. The commonly cited upper limit does not change for either stage in adults, so the whole span between the reference figure and the ceiling stays where it is.
Beyond reporting those numbers, this evidence review deliberately stops. Pregnancy and breastfeeding are the circumstances where a general reference table matters least and where individual clinical guidance matters most, because nutrient questions there interact with existing conditions, medications, appetite and nausea, dietary restrictions and whatever supplement an antenatal service has already recommended. Anyone who is pregnant, planning a pregnancy or breastfeeding should take questions about vitamin C to their own obstetric provider, midwife or registered dietitian, who can see all of that at once.
Infants, Children and Teenagers
The childhood figures are small: commonly cited near 15 milligrams a day for children aged 1 to 3, near 25 for ages 4 to 8, and near 45 for ages 9 to 13, before the teenage rows arrive near 75 for boys and 65 for girls. Infant values are published as Adequate Intakes, commonly cited near 40 and 50 milligrams for the two half-year bands, because the evidence base for that age is built on observed intakes rather than on experimental requirement data.
Two things follow. Because the numbers are small, ordinary childhood eating patterns that include any fruit tend to reach them without arithmetic, and family-level habits about produce work for the whole table at once rather than needing per-child figures. And because the childhood ceilings are also proportionally lower, the distance between a child’s reference figure and a child’s upper limit is narrower than an adult’s, which is one reason products intended for adults are not simply scaled down for children.
Everything about a child’s intake, and anything at all about an infant’s, belongs with a paediatric clinician rather than a general reference page. This section reports published population figures for context. It is not a target for any child, not an assessment of any child’s diet, and not a basis for giving a child anything.
The Commonly Cited Addition for People Who Smoke
Reference publications attach an explicit adjustment for people who smoke: add roughly 35 milligrams a day to whichever row applies, giving commonly cited figures near 125 milligrams for men and near 110 for women. It is one of very few nutrient recommendations keyed to a behaviour rather than to an age or sex band, which is a signal of how consistent the underlying observation was in the literature the reference bodies reviewed.
The reasoning usually given is that smoking raises the metabolic turnover of ascorbic acid, so a given dietary intake is described as leaving lower circulating concentrations than the same intake in someone who does not smoke. The adjustment is an attempt to bring the reference back in line on that measure. Guidance also commonly suggests that people regularly exposed to secondhand smoke pay attention to reaching at least the standard figure, without setting a separate numeric addition for them.
Two limits on that number are worth stating. It is an intake reference, not a claim that any amount of any nutrient offsets anything about smoking, and it should not be read that way. And in absolute terms it is a small quantity of food, roughly the amount in a modest portion of several everyday vegetables by the typical ranges below. Anything about smoking itself belongs with a clinician who can discuss cessation support.
Vitamin C Daily Dose: Why an Intake Figure Is Not a Dose
Searches for a vitamin C daily dose are common, and the word is worth separating from the numbers on this page, because the two ideas answer different questions. A dose is an amount of something given to a person for a purpose, chosen by somebody qualified to choose it and adjusted to that person. The figures here are nothing of the sort. Roughly 90 milligrams for adult men and roughly 75 for adult women are population reference intakes describing what ordinary eating is expected to supply across a whole group.
The distinction has consequences rather than being a matter of vocabulary. A reference intake carries a deliberate margin above the average requirement, so most individual readers sit below the printed figure without being short of anything, and a dose has no such margin because it is aimed at one person. A reference intake also describes habitual eating averaged over time, while a dose is usually tied to a schedule. Reading the first as though it were the second produces exactly the anxious daily arithmetic this evidence review keeps arguing against.
So the honest answer to a question phrased as a daily dose is that this page does not have one and could not supply one. What it reports is the recommended daily intake figures health authorities publish, and the ceiling those same authorities describe. Anything that would genuinely be a dose, meaning an amount of a supplement chosen for a particular person for a particular reason, is a decision for a doctor, pharmacist or registered dietitian who can see the whole picture, and nothing here substitutes for that conversation.
EAR, RDA, AI and UL: Four Numbers, Four Questions
Most of the confusion around a figure like 90 milligrams comes from not knowing which of four different published quantities is being quoted, so it is worth separating them once. The Estimated Average Requirement is the intake estimated to meet the needs of half a group. The Recommended Dietary Allowance is derived from it and set high enough to cover nearly all healthy people in that group, which is why an RDA always sits above an EAR and why it is deliberately generous for the average reader.
The Adequate Intake is used where the evidence will not support an EAR at all. It is an observed or approximated intake in an apparently healthy population, which is why it appears on the infant rows and why it carries less certainty rather than more. The Tolerable Upper Intake Level sits at the far end and answers a different question entirely: not how much is enough, but how much routine intake from all sources is judged unlikely to cause harm.
Reading the vitamin C table with those four in hand, the adult figure of roughly 90 is an RDA, the infant figures are Adequate Intakes, and the roughly 2,000 milligram figure is an upper limit. They are not points on one scale of goodness. They answer separate questions and are derived by separate methods, which is exactly why treating a ceiling as an aspiration is a category error rather than an aggressive choice.
Why the Figure Is a Reference Range and Not a Target
The single most useful idea on this page is that a reference intake describes a population, not a person, and describes a day only as a convenient unit. Three properties of an RDA follow from how it is built, and each one loosens the grip the number tends to have on people who find it.
It has a margin built in. Because the RDA is set above the estimated average requirement to cover nearly everyone, most individual readers need less than the printed value. A day at eighty percent of an RDA is, for most people, still above their own requirement, which is why a shortfall on a single day is not a finding about anything.
It averages over time. Body pools of vitamin C do not empty overnight, and reference intakes are framed as habitual daily intakes rather than as a quota that resets at midnight. A week is the more useful unit for a reader, and a produce-light Tuesday balanced by a produce-heavy Saturday is unremarkable.
And it is revisable. Reference intakes are the output of expert review of a body of evidence at a point in time, they differ between countries that reviewed the same evidence, and they are periodically reopened. That is a normal feature of the process rather than a weakness, but it does mean the honest posture toward any specific number, including every one on this page, is that it is the commonly cited current value and confirmable at the publishing authority.
Where the Adult Figure Came From
The adult figure is not a round number pulled from nowhere, and knowing roughly how it was derived makes it easier to hold at the right level of confidence. The reference bodies did not set the intake at the amount needed to avoid overt deficiency. They set it against a marker of body pools being adequately filled, described in terms of near-maximal concentrations of the vitamin in circulating white cells with minimal loss in urine, which is a considerably higher bar.
That choice is why the gap between the two relevant numbers is so wide. The intake commonly described as sufficient to prevent overt deficiency is very much smaller than the reference intake, roughly an order of magnitude smaller by the figures usually quoted. Someone can therefore sit far above the deficiency threshold and still below the reference intake, which is the ordinary state of a low-produce diet and is not a disease.
Holding both facts at once is the correct reading. The reference figure is a target for population adequacy with a deliberate margin, not a cliff edge. This evidence review does not describe what deficiency looks like, does not list symptoms, and does not offer any way to judge nutritional status from a page, because that assessment is clinical and is made with a history and, where relevant, tests.
The 2,000 mg Upper Limit Is a Boundary, Not a Goal
The Tolerable Upper Intake Level commonly cited for adults is roughly 2,000 milligrams a day, and the childhood ceilings are considerably lower. Commonly cited figures are near 400 milligrams for ages 1 to 3, near 650 for ages 4 to 8, near 1,200 for ages 9 to 13 and near 1,800 for ages 14 to 18. The adult figure does not change in pregnancy or lactation.
Three things a Tolerable Upper Intake Level is not are worth naming. It is not a target, and nothing about approaching it is desirable. It is not a sharp line at which harm begins, since it is set with its own margin below the intakes where adverse effects were observed. And it is not a per-serving figure. It describes habitual daily intake counting every source together, which is the property that matters most.
What the ceiling does usefully is put the reference intake in perspective. Roughly 75 to 90 milligrams against roughly 2,000 is a span of more than twentyfold, and the food sections below show that even a produce-heavy day lands in the low hundreds of milligrams. That is the arithmetic worth carrying away: the ceiling is not a live question for anyone eating food, and any question about intake beyond what food supplies is one for a clinician rather than for a reference page. Check where a sketched day sits against both ends in the companion below.
Why This Page Quotes No Absorption Percentage
Readers looking for vitamin C figures often meet confident absorption percentages, and none appear here. The reason is not caution for its own sake. It is that the published estimates vary widely with the amount consumed, the food matrix, the measurement method and the person, and quoting a single figure would misrepresent that spread as settled.
What can be said honestly is the mechanism and its direction. Uptake of ascorbic acid in the intestine is carrier mediated, and carrier-mediated transport saturates. As the amount taken at one time rises, the fraction crossing the gut wall falls, and the kidneys clear more of what does cross once circulating levels are filled. So the relationship between amount consumed and amount retained is not proportional, and it flattens.
That mechanism explains something the milligram tables cannot. The amounts food supplies, tens of milligrams at a sitting spread over a day, sit in the range where the transport system is working comfortably rather than at its limit. It is a description of physiology offered as background, not a recommendation about amounts, and it is the reason this evidence review counts milligrams on the plate rather than pretending to count milligrams retained.
Food Sources of Vitamin C: A Reference Table
The figures below are typical ranges for ordinary servings rather than measurements. They move with variety and cultivar, growing conditions, ripeness at harvest, how long the item has been stored and how it was prepared, which is a larger source of variation for vitamin C than for most nutrients. The midpoint column exists only so the charts and worked example on this page have one consistent number to use.
| Food | Serving | Typical range | Midpoint used here |
|---|---|---|---|
| Red bell pepper, raw | 1/2 cup | ~80 to 100 mg | ~90 mg |
| Orange juice | 3/4 cup | ~75 to 95 mg | ~85 mg |
| Orange | 1 medium | ~60 to 80 mg | ~70 mg |
| Kiwi | 1 medium | ~55 to 75 mg | ~65 mg |
| Green bell pepper, raw | 1/2 cup | ~50 to 70 mg | ~60 mg |
| Broccoli, cooked | 1/2 cup | ~40 to 60 mg | ~50 mg |
| Strawberries, sliced | 1/2 cup | ~40 to 55 mg | ~48 mg |
| Brussels sprouts, cooked | 1/2 cup | ~38 to 52 mg | ~45 mg |
| Grapefruit | 1/2 medium | ~30 to 45 mg | ~38 mg |
| Cantaloupe, cubed | 1/2 cup | ~24 to 34 mg | ~29 mg |
| Cabbage, cooked | 1/2 cup | ~22 to 34 mg | ~28 mg |
| Mango, sliced | 1/2 cup | ~20 to 35 mg | ~28 mg |
| Cauliflower, raw | 1/2 cup | ~20 to 32 mg | ~26 mg |
| Potato, baked with skin | 1 medium | ~12 to 22 mg | ~17 mg |
| Tomato, raw | 1 medium | ~12 to 22 mg | ~17 mg |
| Fortified drink, cereal or bar | 1 serving | varies entirely by brand | read the panel |
The last row is the important one, and it has no number on purpose. Where vitamin C has been added to a product, the amount is a manufacturer’s decision rather than a property of the food, so the only figure that describes what you actually bought is the one printed on your own package. That is true of the unfortified rows too, in a softer way: a table describes a category, and a panel describes an item.
Which Foods Carry the Most per Serving
Vitamin C per common serving
Midpoints of twelve of the typical ranges above, against adult reference intakes commonly cited near 75 to 90 mg a day. Fortified products are left out because the amount added varies by brand.
Bars scale to raw red bell pepper at 100 percent. Each bar is the midpoint of a typical range that varies with variety, ripeness, storage and preparation, so read bar length as an approximate ordering rather than a measurement, and never as a personal target.
Two readings of that chart are worth more than any single bar. The first is that several ordinary single servings sit at or near an adult reference figure by themselves, which is the whole reason the reference intake is described as an undemanding one where fresh produce is available. The second is that the bars at the bottom still matter, because people eat those foods in quantity and repetitively. A potato is a modest source per serving and has historically been an important one in some diets purely through volume.
The chart also carries a limit inside it. Bar length is the midpoint of a range that is genuinely wide, and for several rows the top of one item’s range overlaps the bottom of the item above it. Reading the ordering as fixed is reading more precision than the underlying figures support.
Citrus Is Not the Only Source
The strongest association most people hold about vitamin C is with oranges, and it is worth loosening, because it produces a narrow and slightly inaccurate picture of where the nutrient sits. By the typical ranges above, half a cup of raw red bell pepper carries more than a medium orange. Kiwi sits close behind an orange in a much smaller item. Broccoli, Brussels sprouts, cabbage and cauliflower, none of which anyone associates with the nutrient, are all meaningful contributors, and strawberries, cantaloupe, mango and papaya all pay in.
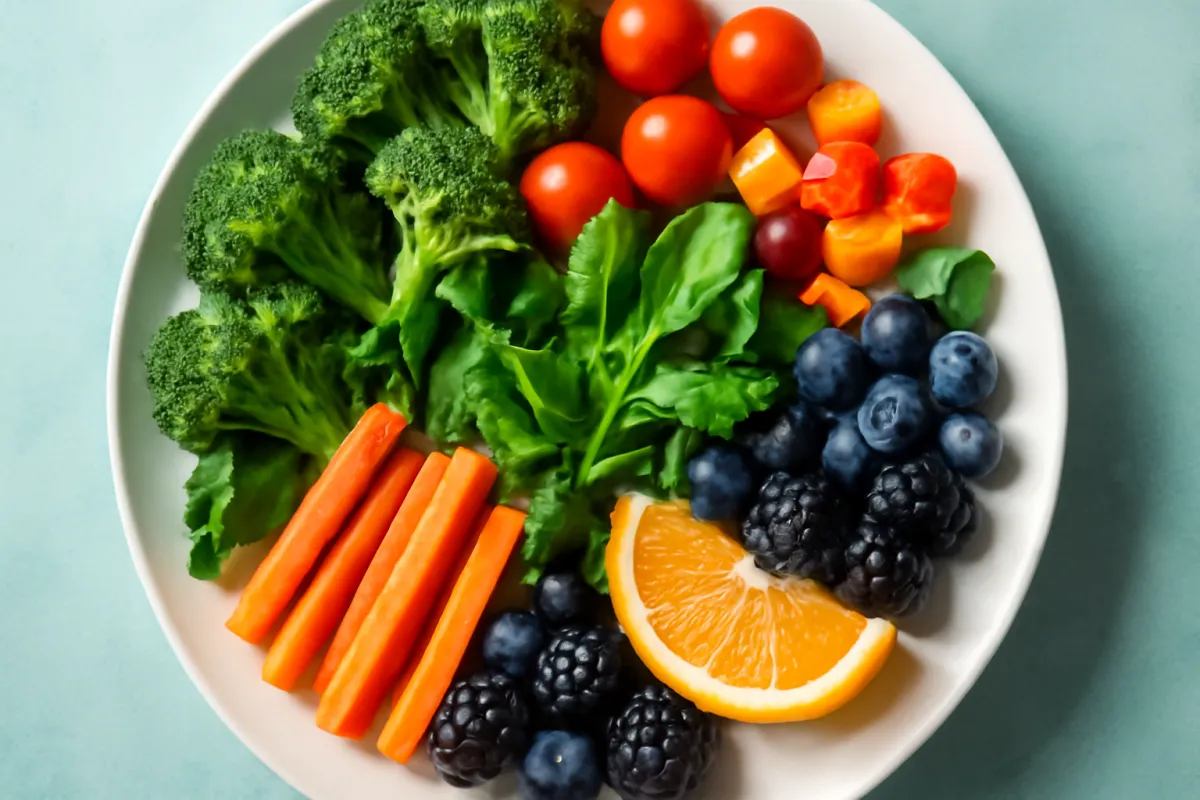
That matters practically for anyone who dislikes citrus, avoids it for reflux, or takes a medication with a known grapefruit interaction, and it matters in reverse too: somebody who eats vegetables generously and little fruit is unlikely to be short without a single orange in the week. The wider pattern, that a varied plate does work no single food can, is the same one running through our balanced meal method and our high fiber foods list, where many of the same items appear for a different reason.
Why the Same Food Gives a Different Answer Twice
Vitamin C is unusually variable in food, and the reasons are worth understanding rather than treating the ranges above as sloppiness. Cultivar is the first: different varieties of the same fruit or vegetable are commonly reported at meaningfully different levels, which is why a red bell pepper and a green one from the same plant family differ so much. Ripeness is the second, since content commonly changes as an item matures on the plant and then again after picking.
Growing conditions contribute as well, including light exposure, season and how the crop was grown and fed. And then there is everything after harvest: time in transit, temperature during storage, whether the item was chilled, and how long it sat on a shelf and then in a fridge before it was eaten. Ascorbic acid oxidises steadily on exposure to air and light, so time is itself a variable.
The honest conclusion is the one this evidence review has already taken: give ranges, name the midpoint used for arithmetic, and treat the exact figure as unknowable for any particular pepper. For packaged and fortified items, that uncertainty is replaced by a different and better answer, which is the declared figure on your own panel. Precision about milligrams is not available for whole produce, and it is not needed for a number that is a population reference anyway.
Cooking, Water and Heat
Two properties of ascorbic acid explain almost everything about what cooking does to it. It is heat sensitive, so a share of it degrades at cooking temperatures and more degrades the longer the heat is applied. And it is water soluble, so where a food is cooked in water, a share of what survives the heat leaves the food and ends up in the water.
Those two mechanisms rank the methods without needing any percentage. Boiling with the cooking water discarded engages both losses at once and is commonly described as the heaviest. Steaming and microwaving limit contact with water and are commonly described as gentler, and brief stir-frying holds up reasonably because the time is short. Raw preserves the most, which is not an argument that raw is better overall, only that it is the endpoint of this particular scale.

No retention percentage appears here for the same reason no absorption percentage does. Published figures for how much survives a given method vary enormously with the food, the piece size, the temperature and the duration, and a confident single number would be an invention. The practical version is proportionate rather than anxious: some raw produce across a week, shorter cooking where it suits the dish, and using the cooking liquid in a soup or sauce when it is convenient. None of that is a rule, and cooked vegetables remain worth eating on every other count.
Storage, Cutting and Holding Warm
Cooking gets the attention, but the losses that happen before and after the pan are often larger, and they are the ones a reader can most easily influence. Time is the main variable. An item sitting in a fridge for a fortnight is commonly described as carrying less than the same item did on the day it was picked, and warmer storage accelerates the change.
Cutting is the second. Slicing exposes interior surfaces to air, so produce prepared well in advance loses more than produce prepared just before eating. The same logic applies to grated, shredded and pre-cut items, which is a reason to treat a bag of pre-cut vegetables as convenience rather than as equivalent to whole produce on this one measure, without treating it as worthless either.
Holding warm is the third and is easy to overlook. Food kept hot on a stove, in a warming drawer or on a buffet continues to lose vitamin C for as long as it is held, which is why the same dish can read differently at the start and end of a service. None of this needs to become a rule about how anyone cooks. It is a mechanism worth knowing, because it explains why a single milligram figure for a food cannot be more than an approximation. Our meal prep walkthrough covers the trade-off between convenience and freshness more generally.
Frozen, Canned and Juiced
Frozen produce is the most commonly misjudged category on this topic. Items destined for freezing are often processed soon after harvest, and freezing largely halts the slow oxidation that continues in fresh produce during transit and storage. So frozen vegetables and fruit are commonly described as comparing favourably with fresh items that have travelled and waited, rather than as an inferior substitute. The blanching step before freezing does cost some vitamin C, which is why the comparison is described as favourable rather than as a clear win.
Canning involves heat, and canned produce is generally described as carrying less vitamin C than fresh or frozen equivalents of the same food, with some of what remains sitting in the packing liquid. That is a reason to read the panel where one is printed rather than to avoid the category, particularly since canned goods carry cost and shelf-life advantages that our budget eating walkthrough treats directly.
Juice is a separate case with two effects pulling in opposite directions. A glass concentrates the flesh of several fruits, which raises the figure per serving, and juice is also frequently fortified, which raises it again by an amount only the panel discloses. Against that, juice removes most of the fibre and is a concentrated source of sugars, which our sugar intake reference and our hidden sugar note both work through.
Fortified Products and the Panel on Your Own Package
Vitamin C is among the nutrients most frequently added to processed products, partly for nutritional labelling and partly because ascorbic acid also functions as a processing aid. Fortified drinks, cereals, bars, sweets and powders can therefore declare figures far above anything whole produce carries per serving, and none of that is a property of the underlying food.
The consequence for a reader is simple and worth stating without hedging: for any product with a panel, the panel is the figure, and any table on any website, including the one above, is at best a category average. This applies with particular force to the fortified rows, where the number is a formulation decision that can differ between two products on the same shelf and can change between production runs.
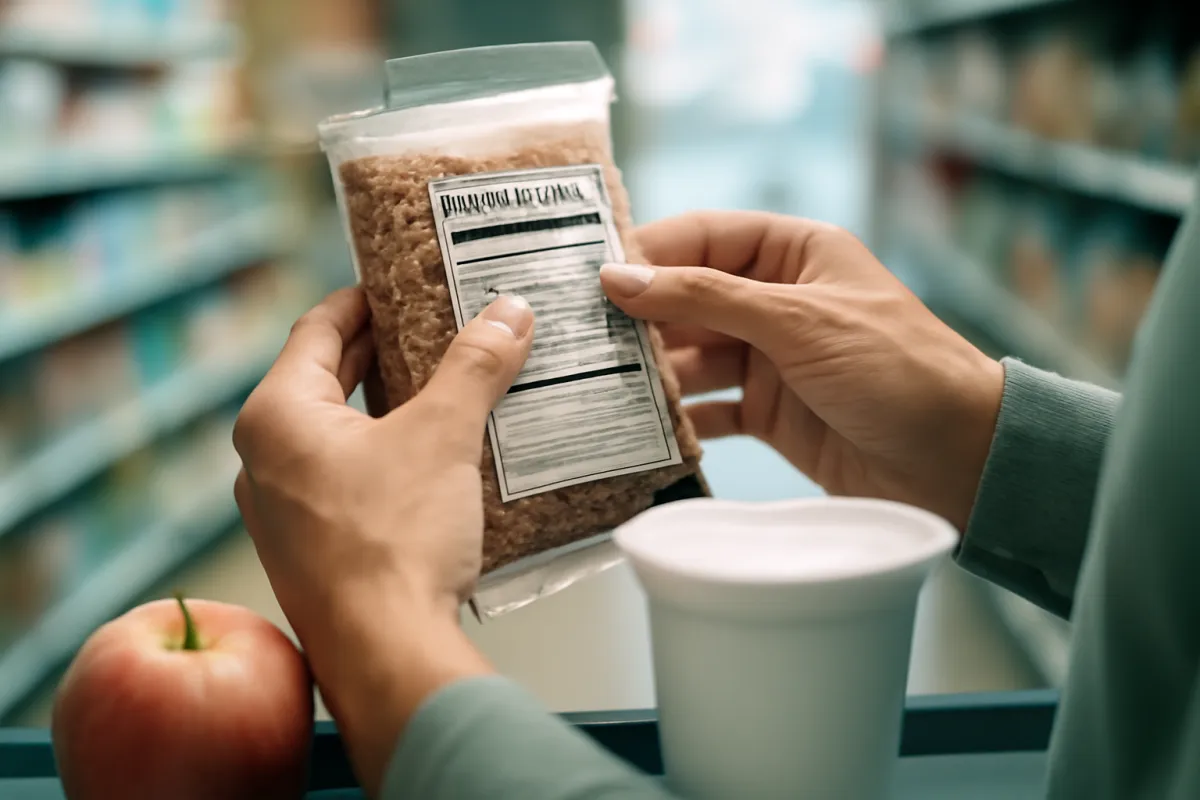
A related caution belongs with the marketing rather than the nutrient. A large declared percentage on the front of a package says nothing about the rest of the product, and drinks and sweets carrying a prominent vitamin C claim alongside a substantial added sugar figure are a common pattern. Reading the whole panel rather than the front of the box is the habit our nutrition label walkthrough is built around.
Vitamin C and Plant Iron at the Same Meal
One property of vitamin C is practically useful at the table and has nothing to do with the reference intake. Ascorbic acid is the most consistently described enhancer of non-heme iron uptake, meaning the iron found in beans, lentils, tofu, greens and fortified grains. The mechanism usually given is chemical: it keeps iron in a more soluble form in the gut and forms a complex with it that resists the binding agents in the same foods.
The practical form of that is a pairing habit rather than anything to measure. A squeeze of lemon over a lentil dish, peppers or tomatoes in a bean stew, or fruit alongside a fortified breakfast are the arrangements usually described, and the timing that matters is the same meal rather than the same day. Our iron reference works through the enhancers and inhibitors in detail, and our iron food list covers the sources.
No percentage appears here for the size of that effect, for the same reason as elsewhere on this page: published estimates vary widely with the meal, the amounts involved and the person’s own iron stores. The direction is consistently described; the magnitude is not a single number. This is a description of general nutrition science offered as background, and anything about iron status or an iron-related diagnosis belongs with a doctor.
The 90 mg Daily Value on a Nutrition Facts Panel
Food and supplement labels do not use the RDA directly. They use the Daily Value, a single labelling reference chosen so one number can serve a whole population, and the Daily Value commonly cited for vitamin C on United States nutrition labels is 90 milligrams a day. A product showing 20 percent of the Daily Value is therefore declaring roughly 18 milligrams.
The distinction matters when reading percentages. A Daily Value is not tailored to sex, life stage or smoking status, so it happens to match the commonly cited male adult figure, sits above the female adult figure, and sits well below the commonly cited breastfeeding figure and below the smoking-adjusted figures for either sex. A panel percentage therefore reads about right for one group and off for several others.
The general habit holds here as with every nutrient: read the milligram figure where it is given and treat the percentage as a rough screen, because milligrams are absolute and addable across a day while percentages depend on a denominator you did not choose. Labelling rules are set by the regulator, are periodically revised, and differ between countries, so what must be declared and against which Daily Value is a question for the agency’s current guidance rather than for any article.
An Illustrative Day That Reaches 227 mg
Here is one illustrative day assembled from the midpoints in the reference table, built only to show the arithmetic. It is not a meal plan, not a recommendation, and not a claim about any health outcome. It uses four ordinary items and no fortified product, so every figure in it is a whole-food midpoint with the range still attached.
| Meal | Foods | Vitamin C, midpoints |
|---|---|---|
| Breakfast | 1 medium orange (~70 mg) | ~70 mg |
| Lunch | Salad with 1/2 cup raw red bell pepper (~90 mg) and 1 medium tomato (~17 mg) | ~107 mg |
| Dinner | 1/2 cup cooked broccoli (~50 mg) | ~50 mg |
| Total | ~227 mg |
Three comparisons make that total useful. Against the commonly cited adult reference intakes of roughly 75 to 90 milligrams, the day is roughly two and a half to three times over. Against the smoking-adjusted figures near 110 to 125, it is still comfortably above. Against the commonly cited upper limit of roughly 2,000 milligrams, it is roughly a tenth of the way, which is the clearest single illustration of why food does not raise the ceiling question.
Where an illustrative 227 mg day comes from
Shares of the worked day above, using the midpoints from the reference table. Approximations for arithmetic, not a meal plan and not a target.
Segments sum to 100 percent of the illustrative 227 mg day. Each segment is a range midpoint rather than a measurement, and the broccoli figure in particular would move with how it was cooked.
Swap the items and the conclusion holds. A kiwi at breakfast, a cup of cabbage slaw at lunch and a portion of Brussels sprouts at dinner arrives in a similar place, and so does a version built on grapefruit, cauliflower and strawberries. That robustness is the point of the example rather than the total itself. Build your own version in the companion below to see how a sketched day reads against the row you selected.
What a Supplement Facts Panel Tells You
If a product with a Supplement Facts panel is in front of you, what the panel does and does not say is worth reading correctly, separately from any question about whether to use it. The panel declares an amount per serving and defines the serving, and the serving is not always one unit. A product declaring an amount per serving of two capsules is declaring it for two.
The form is usually listed as ascorbic acid or as a mineral ascorbate such as sodium or calcium ascorbate. Claims that one form is dramatically better absorbed than another are commonly made in marketing and are not well supported in the literature, and where a product is a mineral ascorbate the mineral itself is also being supplied, which is a detail worth noticing on a sodium-restricted diet. The other ingredients line matters too, since chewable and gum-style products commonly carry added sugars.
It is also worth knowing that supplements are regulated differently from medicines in many countries, generally with less pre-market verification of content and claims, which is why third-party testing marks carry some information. Nothing in this section recommends any product, form or amount. It describes how to read a panel, and the question of whether to buy anything at all is addressed, honestly, in the next section.
Why This Page Does Not Say Who Should Supplement
This evidence review does not tell anyone whether to take a vitamin C supplement, does not suggest an amount, and does not name groups who should. That is a deliberate limit rather than an omission, and the reasoning is worth stating so it does not read as evasion.
The judgement depends on things a page cannot see. It depends on what somebody actually eats across a normal week rather than on a remembered day, on medications and their interactions, on medical history, on conditions affecting intake or absorption, and in some cases on test results interpreted by somebody qualified to interpret them. It also depends on the whole picture rather than one nutrient, since a diet short on vitamin C is usually short on several things at once and a single tablet addresses only one column.
There is a second reason. Reporting published reference figures is a different act from advising a particular person about their own intake, and this evidence review stays firmly on the first side of that line. Reviewing content for accuracy is not the same thing as a consultation about anybody, and nothing here is offered as one. Anyone weighing a supplement should take the question to a doctor, pharmacist or registered dietitian who can see the full history, exactly as our vitamin D reference and our vitamin B12 reference make the same handover on their own nutrients.
Common Mistakes When Counting Vitamin C
A handful of recurring errors account for most of the confusion around this nutrient, and naming them is more useful than adding another number.
- Confusing the reference intake with the upper limit. Roughly 75 to 90 milligrams is a population reference intake. Roughly 2,000 is a ceiling counting every source together. They answer different questions and are derived by different methods.
- Reading the label Daily Value as a personal figure. The 90 milligram Daily Value is a single labelling reference that does not adjust for sex, life stage or smoking status, so a percentage on a package is a comparison device rather than a scorecard.
- Treating a table figure as a measurement. Every whole-food number on this page is the midpoint of a genuinely wide range that moves with variety, ripeness, storage and cooking. For a packaged item the panel replaces the table entirely.
- Assuming citrus is the source. Raw red bell pepper is commonly cited above a medium orange per serving, and broccoli, kiwi, strawberries, sprouts and cabbage all contribute meaningfully.
- Treating a day under the figure as a finding. Reference intakes are habitual intakes with a built-in margin. A single day is the wrong unit, and no page can assess anyone’s status.
- Comparing unlike columns across food pages. A food can lead one nutrient table and be absent from another, which is why our peanut butter calorie note and this page describe different columns of the same plate rather than competing verdicts.
When the Question Belongs With a Clinician
Four situations are worth naming explicitly, because they mark where a general nutrition page stops being the right source. The first is any thought of taking a supplement, for the reasons set out above, since that rests on a full picture rather than on intake arithmetic.
The second is pregnancy or breastfeeding, where the reference figures differ, where antenatal and postnatal care already cover nutrition, and where a supplement may already have been recommended by someone with the whole history. The third is anything concerning an infant or child, which is paediatric territory and where the figures on this page function only as background.
The fourth is any existing medical condition, any regular medication, or any question that is really about symptoms or diagnosis rather than about intake. This evidence review deliberately contains no symptom list and no way to judge nutritional status from a page, because self-matching against general descriptions misleads in both directions. Our carbohydrate reference and our snack ideas list draw the same boundary on their own topics: the arithmetic is public, the assessment is clinical.
The Bottom Line
How much vitamin C per day is one of the more settled questions on the reference table and one of the less precise ones in the kitchen. The commonly cited adult figures are roughly 90 milligrams a day for men aged 19 and older and roughly 75 for women aged 19 and older, with no further split by age, alongside roughly 85 in pregnancy, roughly 120 while breastfeeding, smaller figures across every childhood band, and an addition of roughly 35 described for people who smoke. Those are population reference values with a deliberate margin, published by health authorities, reviewed and revised over time, and worth confirming for your own row at the source rather than taking from this page.
The upper end is easier still. The commonly cited ceiling of roughly 2,000 milligrams a day for adults is a boundary rather than a goal, it counts every source together, and the twentyfold gap between it and the reference intake is why food alone never brings it into play. An illustrative day of an orange, half a cup of raw red pepper, a tomato and half a cup of cooked broccoli lands near 227 milligrams, comfortably above the reference figures and roughly a tenth of the way to the ceiling.
The food half of the answer needs more humility than the table half. Vitamin C content moves with variety, ripeness, growing conditions, storage time, cutting, heat and water, which is why every whole-food figure here is a range with a midpoint rather than a measurement, and why a panel on your own package beats any table where one exists. Nothing above says whether anyone should take a supplement, names who should, or claims that vitamin C prevents or treats any illness. Those questions belong with a doctor, pharmacist or registered dietitian, and the companion below is a sketching tool for the arithmetic rather than an answer about anybody.
This evidence review is published for general education and reproduces commonly cited, approximate reference intakes and food composition figures for vitamin C. It is not medical, dietary or nutritional advice, it does not diagnose, treat or manage any condition, and reading it creates no clinician-patient relationship. Population reference intakes, Adequate Intakes and Tolerable Upper Intake Levels are published by national health authorities, are reviewed and revised over time, and differ between countries, so the figure current for your own age, sex and life stage should be confirmed against the publishing authority rather than taken from this page. Every milligram value above for a whole food is the midpoint of a typical range rather than a measurement of any particular pepper, orange or floret, because content varies with cultivar, ripeness, growing conditions, storage, cutting, heat and water, and where a product carries a panel that panel is the only figure describing what you bought. No absorption percentage and no cooking retention percentage appear above, deliberately, because published estimates vary too widely with the food, the amount and the person to state as fact. Nothing here recommends a vitamin C supplement, suggests an amount or duration for one, or identifies who should take one, and no symptom list appears, since nutritional status is established clinically rather than by matching a description on a website. Nothing above claims that vitamin C prevents, treats, shortens or cures any illness or infection. Anyone who is pregnant or breastfeeding, asking on behalf of an infant or child, living with any medical condition, taking regular medication, or considering any intake beyond ordinary food should take the question to a doctor, pharmacist or registered dietitian who knows the full history.
Frequently asked questions
How much vitamin C per day do adults need?
The Recommended Dietary Allowances published by the Food and Nutrition Board of the National Academies are commonly cited at roughly 90 milligrams a day for men aged 19 and older and roughly 75 milligrams a day for women aged 19 and older. Those are population reference values written to cover the requirement of nearly all healthy people in a group, not personal quotas, and a day that lands under one of them is not a finding about anybody. Reference intakes are reviewed and revised over time and differ between countries, so the current figure for your own age, sex and life stage is worth confirming against the publishing health authority rather than taken from any article, this one included.
Is there a recommended daily dose of vitamin C?
Published figures are recommended daily intakes rather than doses, and the difference is worth holding onto. A recommended daily intake is a population reference describing roughly what ordinary eating is expected to supply across a group, commonly cited near 90 milligrams a day for men aged 19 and older and near 75 milligrams for women aged 19 and older, and it is set with a deliberate margin above the average requirement. A dose is an amount chosen for one person for a particular reason, by somebody qualified to choose it. This evidence review reports the first and never the second, so anyone asking what amount of a supplement to take should put that question to a doctor, pharmacist or registered dietitian who knows their full history.
How much vitamin C per day for a woman?
The commonly cited Recommended Dietary Allowance for women aged 19 and older is roughly 75 milligrams a day, which is the figure most reference tables print for the whole adult female range with no further split by age. Two rows sit apart from it. Pregnancy is commonly cited near 85 milligrams and breastfeeding near 120 milligrams, which is the largest figure anywhere on the vitamin C table. Girls aged 14 to 18 are commonly cited near 65 milligrams. Reference publications also describe an addition of roughly 35 milligrams for people who smoke. Every one of those is a population reference value published by a health authority, subject to revision, and worth confirming at source.
Does the vitamin C figure change in pregnancy or breastfeeding?
Yes, both stages carry their own rows on the reference table. Pregnancy in adults is commonly cited near 85 milligrams a day against the 75 milligrams printed for other adult women, and breastfeeding near 120 milligrams, the higher figure reflecting the amount described as passing into breast milk. Teen pregnancy and lactation values are commonly cited slightly lower, in line with the lower teen baseline. The commonly cited upper limit does not move for either stage. Pregnancy and breastfeeding are exactly the circumstances where a general reference table matters least and where antenatal or postnatal care is already covering nutrition, so questions belong there rather than here.
What is the vitamin C upper limit, and what does it mean?
The Tolerable Upper Intake Level commonly cited for adults is roughly 2,000 milligrams a day. A Tolerable Upper Intake Level is a boundary rather than a goal, and it is not a line where harm begins on one side and stops on the other. It describes the highest routine daily intake from all sources that reference bodies judged unlikely to pose a risk of adverse effects for almost everyone in a healthy population, with the margin of safety shrinking as intake climbs above it. The gap between roughly 75 to 90 milligrams and roughly 2,000 is why ordinary food never raises the question. The ceiling counts every source together, so anything past food belongs in a conversation with a clinician.
Which foods carry the most vitamin C?
By ordinary serving, raw red bell pepper is commonly cited highest among everyday items, in a typical range around 80 to 100 milligrams for half a cup, which is more than a medium orange. A glass of orange juice, a medium orange and a kiwi follow, then green bell pepper, cooked broccoli, strawberries and Brussels sprouts, with grapefruit, cantaloupe, cabbage, cauliflower, tomatoes and potatoes contributing smaller but real amounts. The useful pattern is that vitamin C is spread across fruit and vegetables generally rather than concentrated in citrus. Every one of those figures is a typical range rather than a measurement, since content moves with variety, ripeness, storage and cooking, and the panel on your own package is the figure that describes what you bought.
Does cooking or storage change how much vitamin C is in food?
Yes, and more than for most nutrients, which is why this evidence review gives ranges rather than single values. Ascorbic acid is both heat sensitive and water soluble, so heat degrades a share of it and water carries a share of it away, which is why boiling with the water discarded is commonly described as the heaviest loss and why steaming, microwaving and brief stir-frying are described as gentler. It also oxidises on exposure to air, light and time, so long storage, cutting well in advance and holding cooked food warm all reduce what reaches the plate. No percentage appears here because published retention estimates vary far too widely with the food and the method to state as a fact.
Do people who smoke have a different reference figure?
Reference publications commonly describe an addition of roughly 35 milligrams a day for people who smoke, which brings the commonly cited figures to roughly 125 milligrams for men and roughly 110 milligrams for women. It is one of very few nutrient adjustments keyed to a behaviour rather than to an age or sex band. The reasoning usually given is that smoking raises the metabolic turnover of the vitamin, so the same intake is described as leaving lower circulating levels. That adjustment is an intake reference and nothing more. It is not a claim that any intake offsets anything, and the health questions around smoking belong with a clinician rather than with a milligram table.
Should I take a vitamin C supplement?
This evidence review does not answer that and cannot. Nothing above recommends a supplement, suggests an amount for one, or identifies who should take one, because that judgement rests on a person's diet, medications, medical history and, where relevant, test results, none of which a general reference page can see. What this page does is describe published intake reference figures, explain what those figures are and are not, and set out roughly how much vitamin C ordinary foods are commonly cited as carrying. Anyone weighing a supplement should take the question to a doctor, pharmacist or registered dietitian who knows the full history rather than to an article or a product label.

Hamza Hai is the editor of NourishMark. She holds an MBA and reviews the site's articles against our editorial standards, checking that every figure is labelled for what it is, that nothing is presented as verified fact without a source the reader can check, and that the writing stays useful to a non-specialist.

Dr. Shayaan Khan is the medical reviewer for NourishMark. He holds an MBBS from MGM Medical College, Navi Mumbai, and is the author of published research including a narrative review of postpartum anxiety and depression in Mental Health Science. He has taught physiology at university level. He reviews the site's health content for medical accuracy: that physiology and mechanisms are described correctly, that no claim is stated more strongly than the evidence behind it, and that anything specific to an individual reader is sent to that reader's own clinician.
Not medical advice. Dr. Khan reviews NourishMark's health content for medical accuracy. He is not a registered dietitian, he does not hold a United States practising licence, and he is not your doctor. His review does not make anything here medical advice. Always talk to a qualified health professional about your own situation, and never delay or stop care because of something you read here.