
What's in this review
- What is the amount of sugar recommended per day? The answer in grams
- Recommended daily sugar intake: the two commonly cited framings
- How much added sugar per day: the published limits in one table
- Added sugar versus naturally occurring sugar
- Why the two kinds of sugar sit on different lines
- Grams to teaspoons: 4 grams is about 1 teaspoon
- How many teaspoons of sugar per day the ceilings work out to
- Sugar is about 4 calories per gram: the percent math
- Daily sugar intake in grams by calorie level
- The 5 percent version and what it changes
- Sugar per day by group: what the guidance does and does not split
- Where added sugar comes from in a normal day
- Drinks: why one category carries so much of the total
- The quiet sources in everyday savory food
- How to read added sugar off a nutrition label
- Total sugars versus added sugars on the same panel
- The percent daily value beside added sugars
- Serving size is the number that rescales everything
- Sugar aliases in the ingredient list
- Do sweeteners and sugar alcohols count as added sugar?
- Fruit, juice, and dried fruit: which line each lands on
- Why the guidance is a ceiling and not a target
- Lower-added-sugar defaults and the grams they move
- A worked example: one day converted into grams and teaspoons
- Common mistakes with daily sugar numbers
- A quick daily sugar checklist
- The bottom line
Short answer: The commonly cited ceilings apply to added sugar, not to sugar in general. One framing puts it near 25 grams a day for women and 36 grams for men; the other keeps added sugar under 10 percent of daily calories, which is roughly 50 grams at 2,000 calories. About 4 grams of sugar is one teaspoon. These are population reference points that get revised, not personal targets.
What is the amount of sugar recommended per day? The short answer is that dietary guidance sets a ceiling on added sugar, not on sugar in general, and the two commonly cited framings put that ceiling near 25 grams a day for women and 36 grams for men, the figures published by the American Heart Association, or alternatively under 10 percent of daily calories, the limit in the Dietary Guidelines for Americans, which is about 50 grams on a 2,000-calorie day. Everything else in the topic follows from one distinction and one piece of arithmetic. The distinction is between sugar that was put into a food and sugar that was already in it. The arithmetic is that about 4 grams of sugar is 1 teaspoon, and that sugar supplies about 4 calories per gram, which is what turns a percentage of calories into a gram figure you can compare against a label.
This evidence review is a plain-language reference for daily sugar intake in grams. It answers the direct question first, then draws the line between added and naturally occurring sugar that the whole topic turns on, converts both commonly cited ceilings into teaspoons and into percent of calories at every common calorie level, shows where added sugar actually accumulates across an ordinary day, and walks the specific lines on a nutrition panel that let you check any of it yourself. It is general information about published population reference points, those reference points are revised over time and should be confirmed at an official source, and nothing here is medical or dietary advice for any individual. Sugar is one part of the larger carbohydrate picture, which our carbs per day evidence review covers in full, and the fiber that travels with naturally occurring sugar is the subject of our fiber evidence review. Run your own numbers through the companion below.
Key takeaways
- The ceiling is written for added sugar: about 25 grams a day for women and 36 grams for men in one commonly cited framing, or under 10 percent of daily calories in the other, which is roughly 50 grams at 2,000 calories.
- About 4 grams of sugar is 1 teaspoon, so dividing grams by four converts any figure: 25 grams is 6.25 teaspoons, 36 grams is 9 teaspoons, and 50 grams is 12.5 teaspoons.
- Sugar supplies about 4 calories per gram, so the percent version is calories times 0.10 divided by 4, and it scales with intake from about 38 grams at 1,500 calories to 75 grams at 3,000.
- Naturally occurring sugar in whole fruit and plain milk is counted in Total Sugars on a panel but not in the Added Sugars line beneath it, which is the line the ceilings are about.
- Every figure here is a commonly cited population reference point that gets revised, not a personal target, so confirm current values at an official source and anything specific to you with a qualified professional.
What is the amount of sugar recommended per day? The answer in grams
What is the amount of sugar recommended per day? Two ceilings are commonly cited for added sugar: about 25 grams a day for women and about 36 grams a day for men, published by the American Heart Association, or under 10 percent of daily calories, the limit in the Dietary Guidelines for Americans, which converts to roughly 50 grams on a 2,000-calorie day. Both describe added sugar. Neither describes the naturally occurring sugar in whole fruit or plain milk.
The reason there are two numbers rather than one is that they come from different places and answer slightly different questions. The sex-specific grams come from the American Heart Association and are stated as flat daily figures, which makes them easy to remember and easy to check against a label. The under-10-percent version comes from the Dietary Guidelines for Americans and is stated as a share of calories, which makes it scale: someone eating 1,500 calories and someone eating 3,000 get different gram figures from the same rule. The two do not agree, and the flat figures are the tighter of the pair at ordinary calorie levels. That disagreement is informative rather than embarrassing. It tells you these are reference points inside a range that expert bodies draw slightly differently, not a single threshold where one gram matters.
It helps to hold them the way they are written: as population reference points for general education, revisable, and confirmable at their source. They describe a level below which added sugar is unlikely to be crowding much else out of a diet. They are not a quota, not a diagnosis of any particular day, and not a statement about you specifically. This review reports what the commonly cited figures are and shows the arithmetic that converts them into units you can use at a shelf. What amount suits your own body, diet, medications, or health is a question for a doctor or registered dietitian, and the current published values are a question for the official dietary guidance documents rather than any article. Set your own numbers in the companion below to see both framings side by side.
Recommended daily sugar intake: the two commonly cited framings
The phrase recommended daily sugar intake sounds like it should point at one official number the way vitamin figures do, so it is worth being precise about what each framing says and who says it. The flat framing comes from the American Heart Association, which states a daily maximum for added sugar and splits it by sex: roughly 25 grams for most women, roughly 36 grams for most men. The percentage framing comes from the Dietary Guidelines for Americans, published jointly by the USDA and HHS, which says added sugars should stay under 10 percent of total daily calories from age two onward. The World Health Organization publishes its own 10 percent limit alongside a further conditional suggestion that going under 5 percent may offer additional benefit, and it draws that limit around free sugars rather than added sugars, a slightly wider category covered in the table below.
Converting between them is where the picture sharpens. At 2,000 calories, 10 percent is 200 calories of sugar, and at 4 calories per gram that is 50 grams. The 5 percent suggestion at the same calorie level is 25 grams, which happens to land exactly on the flat figure cited for women. So the three commonly quoted numbers are not three unrelated claims. They are two rules that intersect at a familiar calorie level, and noticing that makes them far easier to hold in your head than memorizing them separately.
The honest caveat sits under all of it. These figures are set by committees reading evolving evidence, they are periodically reviewed and updated, and different bodies in different countries publish somewhat different versions. Treating any of them as permanent, or as a personal instruction, reads more into them than they say. The durable part of this review is not which number is currently in force; it is the conversion arithmetic, which does not change when a committee revises a figure. Our macro calculation walkthrough runs the same calories-to-grams conversion across all three energy nutrients at once.
How much added sugar per day: the published limits in one table
Every daily figure in this review is a limit on added sugar, and none of them is a limit on total sugar. Setting the published figures beside each other, with the body that issues each one named, makes both the agreements and the differences visible in a way that quoting a single number never does. The 2,000-calorie column is the worked line: it is what each framing converts to in grams on a 2,000-calorie day at 4 calories per gram.
| Daily figure | Published by | Category it limits | At 2,000 calories | In teaspoons |
|---|---|---|---|---|
| About 25 g, most women | American Heart Association | Added sugars | about 25 g, flat | about 6.25 tsp |
| About 36 g, most men | American Heart Association | Added sugars | about 36 g, flat | about 9 tsp |
| Under 10% of daily calories | Dietary Guidelines for Americans (USDA and HHS) | Added sugars | about 50 g | about 12.5 tsp |
| Under 10% of energy intake | World Health Organization | Free sugars | about 50 g | about 12.5 tsp |
| Under 5% of energy, conditional | World Health Organization | Free sugars | about 25 g | about 6.25 tsp |
| Total sugars on a panel | no daily ceiling published by any of them | natural and added combined | no figure published | no figure published |
| Sugar in whole fruit and plain milk | outside all of the limits above | neither added nor free | no figure published | no figure published |
The two flat rows do not move with calories at all, which is why they sit at the same grams in the 2,000-calorie column as they do everywhere else, while the percentage rows are calories times the share divided by 4. One detail is worth knowing because it explains an apparent slip in the arithmetic: the American Heart Association states its limit in calories first, around 100 a day for most women and 150 for most men, and then converts. Dividing 150 by 4 gives 37.5 grams, but the published figure is 9 teaspoons, or 36 grams, because the teaspoon count is the rounded unit and the grams follow it. Neither figure is wrong; they are the same recommendation expressed in two units, and the gram version inherits a rounding step. Confirm the current wording at the association’s own publication rather than taking a converted figure from anywhere else.
The other difference in the table is a category difference rather than a numeric one, and it matters more than the gram gap. The Dietary Guidelines for Americans limit added sugars, the category a nutrition panel prints. The World Health Organization limits free sugars, which covers added sugars plus the sugars naturally present in honey, syrups, and fruit juices and fruit juice concentrates. So a glass of unsweetened juice contributes nothing to a US added-sugars tally and does contribute to a free-sugars one. Anyone reconciling a number they read against a panel they are holding needs to know which of the two categories the number was written about.
What all of the rows share is what they leave out. Naturally occurring sugars in whole fruit, in vegetables, and in plain milk and plain yogurt are counted differently: they sit inside Total Sugars on a panel, they are excluded from the Added Sugars line beneath it, and they are excluded from the free-sugars category too. That is why no body publishes a total-sugars ceiling, and why a plain yogurt posting a substantial total-sugars figure is not in conflict with any of the limits above. Our common food calorie reference puts the same foods in energy terms, and our walkthrough of spotting hidden sugar on food labels covers reading the added-sugars line in practice. Set your own calorie level in the companion below to see each row recalculated.
Added sugar versus naturally occurring sugar
Before any gram figure means anything, this distinction has to be clear, because the ceilings are written for one kind of sugar and not the other. Added sugar is sugar or syrup put into a food or drink by someone: during manufacturing, during cooking, or at the table. It covers the obvious cases, the sugar in a soft drink or a biscuit, and the less obvious ones, the sugar in a jar of pasta sauce, a bottle of dressing, a flavored yogurt, a breakfast cereal, or a supermarket loaf. Naturally occurring sugar is the sugar that was already in a whole food before anyone touched it: chiefly the fructose in fruit and the lactose in milk and plain yogurt.
Chemically the individual sugar molecules are the same in both cases, which is a point people sometimes raise as if it settles the argument. It does not, because the guidance is not making a claim about the molecule. It is making a claim about the food the molecule arrives in. Sugar occurring naturally in a whole food arrives inside a package of other things, fiber and water in fruit, protein and calcium in milk, and that package is what the distinction is about. Sugar added to a product arrives without any of that unless the rest of the product supplies it.

Why the two kinds of sugar sit on different lines
The clearest evidence that this distinction is not a rhetorical device is that nutrition panels print it. On panels carrying the current format, a Total Sugars line reports every sugar in the product, natural and added together, and an indented Added Sugars line beneath it reports only the portion that was put in. The two lines exist precisely because the daily guidance applies to the second one, and a single combined figure could not support it.
The practical consequence is that Total Sugars on its own tells you very little. A container of plain yogurt can post a substantial total-sugars figure and zero added sugars, because lactose is a sugar. A carton of plain milk does the same. A punnet of fruit, if it carried a panel, would do the same. Meanwhile a product can post a modest total-sugars figure that is almost entirely added. Reading the top line and stopping is the single most common way to draw the wrong conclusion from a panel, and it explains a lot of the confusion people report when a wholesome-looking food seems to be full of sugar.
Two smaller points round this out. First, the distinction is about origin, not about processing in general: sugar squeezed out of fruit into a juice is still classed as naturally occurring, while sugar poured into that same juice afterwards is added. Second, the classification is a labeling rule, and labeling rules differ by country and get revised, so the presence, wording, and reference values of these lines are worth confirming for your own labels at an official source rather than assuming they match what you read online. Our nutrition label walkthrough covers how the rest of the panel is laid out around these lines.
Grams to teaspoons: 4 grams is about 1 teaspoon
Grams are the unit labels use and teaspoons are the unit people can picture, and one rounded conversion connects them: about 4 grams of sugar is 1 teaspoon. It is a convention rather than a precise measurement, since a level teaspoon of granulated sugar weighs a little over 4 grams and the exact figure depends on how packed it is, but 4 is the number every public-facing conversion uses and it is close enough for the purpose. Divide grams by four to get teaspoons; multiply teaspoons by four to get grams.
This one division is the most useful thing in the whole topic, because it turns a line of small print into something with a physical size. An added-sugars line reading 12 grams is 3 teaspoons. One reading 39 grams is 9.75 teaspoons. One reading 8 grams is 2 teaspoons. None of those gram figures mean much on sight; all of the teaspoon figures do, because you have held a teaspoon.
It also works in reverse when a recipe or a habit is measured in spoons rather than grams. Two teaspoons of sugar in a morning coffee is 8 grams. Doing that twice a day is 16 grams, which is already most of the way to the 25-gram figure before any packaged food is involved. That is not a criticism of anyone’s coffee. It is an illustration that the conversion runs both ways and that the arithmetic is genuinely simple once you stop treating grams as an abstraction. The companion below does the same division on whatever figure you enter.
How many teaspoons of sugar per day the ceilings work out to
Running the two commonly cited ceilings through that division makes them concrete. 25 grams divided by 4 is 6.25 teaspoons, which is where the familiar phrasing of about 6 teaspoons a day comes from. 36 grams divided by 4 is exactly 9 teaspoons. The under-10-percent version at 2,000 calories, roughly 50 grams, is 12.5 teaspoons, and the further 5 percent suggestion at the same calorie level is 25 grams, or 6.25 teaspoons again.
Seeing the ceilings as spoon counts changes how single items read. A 12-ounce can of a regular sweetened soft drink typically carries somewhere in the high thirties of grams of added sugar, which is close to 10 teaspoons, so one can sits at or above the whole of the 25-gram figure and right at the 36-gram one. That is a typical range rather than a claim about any particular product, and the only way to know what a specific can carries is the added-sugars line on the can itself, since formulations and can sizes differ.
The same lens works on the small stuff, and this is where it earns its keep. A tablespoon of ketchup, a spoonful of a sweetened sauce, a flavored yogurt, a granola bar, a supermarket bread roll: each of these typically lands somewhere between roughly 2 and 12 grams of added sugar depending entirely on the brand and recipe, which is between half a teaspoon and three teaspoons. Individually none of them registers. Six of them in a day is a meaningful fraction of either ceiling. Check the panel on the specific products you buy regularly rather than trusting any general figure, including the ranges given here.
Sugar is about 4 calories per gram: the percent math
The percentage framing only becomes usable once you can convert it, and doing that needs one more fact: sugar supplies about 4 calories per gram, the same as carbohydrate generally and as protein, and less than half the roughly 9 calories per gram in fat. With that, the conversion is one short calculation in either direction.
Going from a percentage to grams: take your daily calories, multiply by the share, divide by 4. At 2,000 calories, 10 percent is 2,000 times 0.10, which is 200 calories, divided by 4, which is 50 grams. At 1,600 calories the same rule gives 160 divided by 4, or 40 grams. At 2,500 calories it gives 250 divided by 4, or 62.5 grams.
Going from grams back to a percentage: multiply your added-sugar grams by 4 to get calories, divide by your daily calories, multiply by 100. Sixty grams of added sugar is 240 calories; on a 2,000-calorie day that is 12 percent, and on a 3,000-calorie day the same 60 grams is 8 percent. Identical grams, different shares, which is exactly why a bare gram figure quoted without a calorie level cannot be interpreted. The companion below runs both directions at once so you can see a gram estimate and its percentage together. Our daily calorie needs evidence review covers how to estimate the calorie figure this arithmetic depends on.
Daily sugar intake in grams by calorie level
Because the percentage framing scales, the honest way to present it is as a table rather than a single number. Every cell below is calories times the share divided by 4, rounded, so any row can be redone on paper or on a phone in a few seconds. The teaspoon column is simply the 10 percent gram figure divided by four again.
| Daily calories | 10% of calories | 5% of calories | 10% in teaspoons |
|---|---|---|---|
| 1,500 | about 38 g | about 19 g | about 9.5 tsp |
| 1,800 | about 45 g | about 23 g | about 11 tsp |
| 2,000 | about 50 g | about 25 g | about 12.5 tsp |
| 2,200 | about 55 g | about 28 g | about 14 tsp |
| 2,500 | about 63 g | about 31 g | about 16 tsp |
| 3,000 | about 75 g | about 38 g | about 19 tsp |
Read it across rather than down. The reason the same rule produces 38 grams for one person and 75 for another is not that they were given different advice; it is that they eat different amounts, and a share of a bigger number is a bigger number. That single fact resolves most of the arguments people have about sugar figures, where two people compare gram totals without ever comparing calories.
The 10-percent-of-calories added-sugar figure, in grams, by calorie level
Daily calories times 0.10 divided by 4 calories per gram. Arithmetic you can redo yourself, applied to a commonly cited reference point, not a personal target.
Bars scale to the 3,000-calorie figure at 100 percent. Values are calories times 0.10 divided by 4, rounded to the nearest gram. The reference point itself is revisable and set by dietary guidance bodies; confirm current values at an official source.
Two things are worth noticing in the shape. First, the flat 25-gram and 36-gram figures do not move with the bars at all, which is why the flat framing is tighter than the percentage framing for most people and much tighter for anyone eating a lot. Second, no row of this table says anything about who should be at which row. The calorie level is an input you supply, and the table only performs the conversion.
The 5 percent version and what it changes
The further suggestion that going under 5 percent of calories may offer additional benefit is worth stating separately, because it is often quoted as though it were the main rule when it is generally presented as a secondary, conditional one alongside a firmer 10 percent recommendation. Halving the share halves the grams, so the whole middle column of the table above is simply the left column divided by two: about 19 grams at 1,500 calories, 25 at 2,000, 31 at 2,500, 38 at 3,000.
The coincidence worth remembering is the one already noted: 5 percent of 2,000 calories is 25 grams, the same as the flat figure commonly cited for women. That is arithmetic rather than agreement between guidance bodies, but it does mean that at a fairly typical calorie level the tightest commonly cited framings converge on roughly the same gram figure, which is a useful sanity check when you see the numbers quoted in isolation and wonder whether they contradict each other.
What the 5 percent version does not do is create a new threshold to worry about crossing. Like the others, it is a reference point drawn by a committee reading evidence, and like the others it is periodically reviewed. Its practical value here is as the low end of a range, showing that the commonly cited figures for a 2,000-calorie day span roughly 25 to 50 grams, or roughly 6 to 12.5 teaspoons, depending on which framing you read. That range is the honest answer to what the guidance says, and it is a good deal more informative than any one number pulled out of it.
Sugar per day by group: what the guidance does and does not split
People searching for a daily sugar figure often want one for a specific group, so it is worth being explicit about which splits the commonly cited guidance actually makes and which it does not. The split it makes clearly is by sex in the flat framing, 25 grams for women and 36 for men, a difference that tracks typical differences in calorie intake rather than anything specific to sugar. The split it makes implicitly is by calorie level in the percentage framing, which is a finer and more individual split than sex, because it moves with how much a particular person actually eats.
Beyond that, guidance for children is set separately and is generally lower, and it is set differently in different countries and for different age bands. This review does not print a gram figure for children, because getting that wrong would be worse than not printing it, and because the correct figure depends on which country’s guidance and which age band you need. The place to get it is the current published dietary guidance for your country, which states it directly. The same applies to any other group-specific figure you may have seen quoted.
What the guidance does not do is issue different ceilings on health grounds for different individuals. It is written for a general adult population and is silent on individual circumstances, which is exactly why the framing here stays at the level of what the reference points say and what the arithmetic converts them to. Anyone who needs a figure fitted to their own situation, for any reason, needs a doctor or registered dietitian rather than a population reference, and this review does not attempt to stand in for one.
Where added sugar comes from in a normal day
Knowing the ceiling is only half of it; the other half is knowing where the grams accumulate, because that is what tells you where to look. The pattern usually described puts sweetened drinks in first place by a clear margin, sweets and desserts second, and a long tail of everyday savory items third. The breakdown below is a reference shape to reason with, drawn to show the ordering rather than to report a measurement, and it sums to 100 percent.
Where added sugar tends to accumulate across a day
An illustrative reference shape showing the usual ordering of added-sugar sources. Shares sum to 100 percent and are drawn to show where to look first, not measured for any person or country.
Segments are an illustrative reference shape, not survey data. Real splits vary widely by country, by survey, and by person, and your own split is readable from the added-sugars line on what you buy repeatedly.
The value of the shape is not the exact percentages, which nobody should treat as measured. It is the ordering, and the ordering has an arithmetic explanation rather than a mysterious one. A single sweetened drink typically carries more grams than several small hidden sources combined, so one category can dominate a total without appearing more often than the others. The next two sections take the top and the bottom of that ordering in turn.
Drinks: why one category carries so much of the total
The structural reason drinks lead is a matter of grams per item. A typical 12-ounce can of a regular sweetened soft drink lands in the high thirties of grams of added sugar. A large sweetened coffee drink or a flavored bottled tea can land anywhere from the low teens to well above that, depending entirely on size and recipe. Set those against a ceiling of 25 or 36 grams and a single item is most or all of it. Nothing else in an ordinary day comes in units that large, which is why one category can account for close to half a total.
The second factor is that drinks are frequently repeated. A packaged dessert is usually a decision; a drink with lunch is often a default, and defaults repeat daily without being decided each time. Two of them is a number of grams that no amount of care elsewhere on the plate offsets, simply because the arithmetic is not close. That is a statement about grams, not about anyone’s habits.
Fruit juice belongs in this section as a matter of drinking speed rather than labeling. By the labeling rule, unsweetened juice contains naturally occurring sugar and posts nothing on the added-sugars line, so it does not count against the ceilings at all. By the practical arithmetic of a day, it is still a glass of liquid sugar without the fiber of the whole fruit, which is why it is usually discussed alongside sweetened drinks. Both things are true at once, and this review states both rather than picking the tidier one. Our fiber evidence review covers what the removed fiber was doing.
The quiet sources in everyday savory food
At the other end of the ordering sit the items nobody counts. Bread and rolls often contain some added sugar, which helps browning and flavor. Pasta sauces, ketchup, barbecue sauce, and many bottled dressings carry a few grams a serving. Breakfast cereals and granolas vary enormously and some are among the more sugar-dense items in a kitchen. Flavored yogurts can post added-sugar figures that surprise people who chose them as the sensible option. Instant oatmeal sachets, flavored plant milks, and cereal bars all commonly carry some.
The honest way to talk about these is as a range to check rather than a figure to quote, because the spread within each category is wider than the difference between categories. Two pasta sauces on the same shelf can differ by several grams a serving. Two granolas can differ by more. Any number this review printed for a category would be wrong for most specific products in it, which is why the recommendation here is procedural: turn over the four or five savory items you buy most often, read the added-sugars line once, and you will have real figures for your own kitchen instead of averages for someone else’s.
That one-off check is worth more than continuous vigilance, because these items are bought repeatedly. A sauce you buy every week is a decision you make once and then repeat fifty times. Doing the reading once at the shelf converts the whole quiet category from invisible to known, and our healthy grocery list walkthrough covers building that check into a normal shop rather than treating it as a project.
How to read added sugar off a nutrition label
Everything above is checkable from a panel, and the checking takes about fifteen seconds once you know which lines to look at. The sequence is: serving size, then the Added Sugars line, then the percent daily value beside it if there is one, then the ingredient list if anything looks odd. The next three sections take those lines one at a time, and our step-by-step walkthrough of spotting hidden sugar on food labels works through the same process in more detail with the edge cases included.
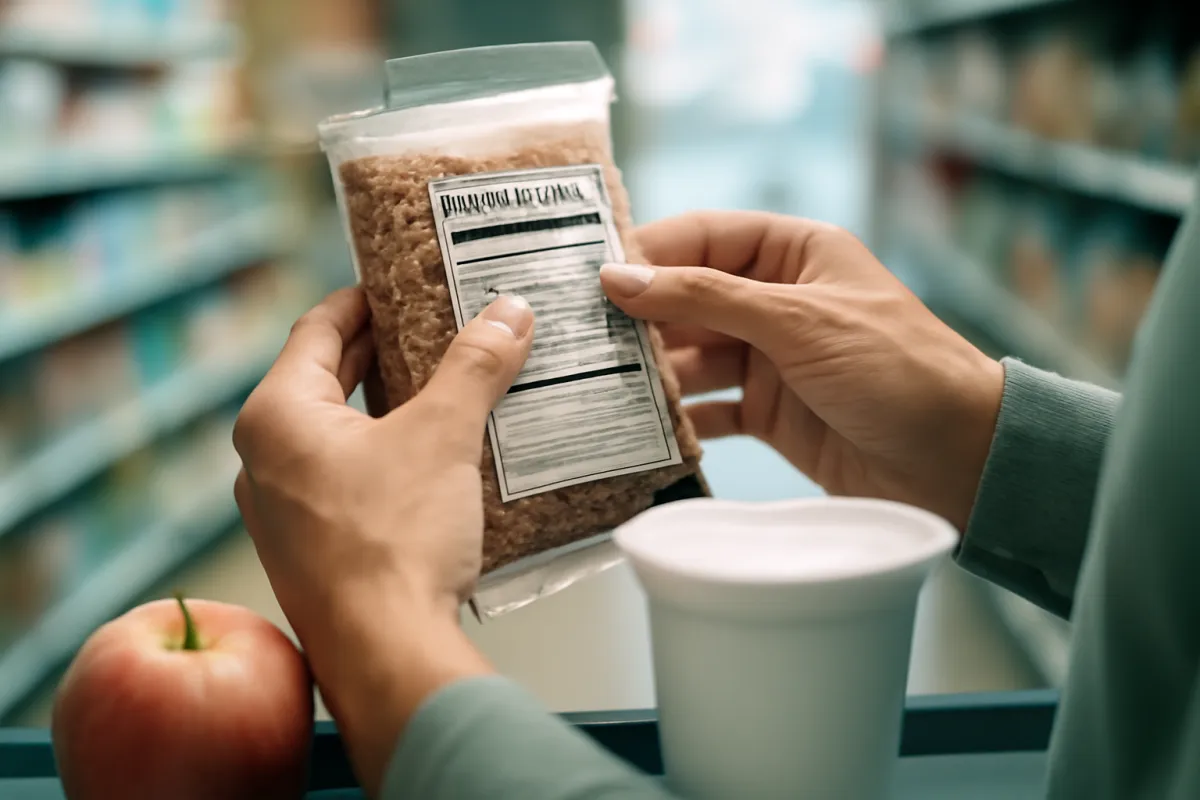
One framing point before the details. A nutrition panel is not an opinion about a food and it does not rank foods as good or bad. It is a measurement, published under rules, that lets you do arithmetic. Everything in this review treats it that way: as the input that makes the gram-to-teaspoon and gram-to-percent conversions apply to something real rather than to a hypothetical.
Total sugars versus added sugars on the same panel
The two sugar lines are the ones that get confused, so it is worth being exact. Total Sugars counts every sugar in the product, naturally occurring and added together. Added Sugars, indented beneath it and usually written as includes so many grams of added sugars, counts only the portion put in. The added-sugars figure can never exceed the total-sugars figure, and it can be zero while the total is substantial.
Three quick examples make the relationship legible. Plain unsweetened yogurt: a meaningful total-sugars figure from lactose, zero added sugars. A sweetened flavored yogurt: a larger total, with the difference between the two lines being roughly what was put in. A regular soft drink: total and added essentially the same, because there was no naturally occurring sugar there to begin with. Reading the gap between the two lines is often more informative than reading either one alone.
This is also where most misplaced sugar anxiety comes from. Whole fruit, plain milk, and plain yogurt post total-sugars figures that look alarming to someone reading only the top line, which is exactly the reading the two-line format was introduced to prevent. If a food’s total sugars are high and its added sugars are zero or near zero, the panel is telling you the sugar was already in the food, and the daily ceilings discussed in this review are not written about it. Our calories in milk reference covers what else is in that particular case.
The percent daily value beside added sugars
On US panels that carry percent daily values, the figure beside added sugars is calculated against a Daily Value reference of 50 grams a day, set by the Food and Drug Administration, which is the 10 percent of a 2,000-calorie reference day worked out at 4 calories per gram. Knowing that one number makes the percentage translatable in your head: 20 percent daily value is 10 grams, 50 percent is 25 grams, 10 percent is 5 grams.
It is worth being clear about what that reference is. It is a labeling convention built so that percent columns can exist on packages, pegged to a 2,000-calorie reference day that was chosen for labeling purposes and is not a statement about how much anyone should eat. If you eat noticeably more or less than 2,000 calories, the percent column is still internally consistent but it is measuring against someone else’s calorie level, which is why the gram figure beside it is the more useful number for your own arithmetic.
Two mechanical cautions apply. First, the percent is per serving, so it inherits every serving-size issue in the next section. Second, label reference values and the rules for calculating them are set by regulators, differ between countries, and are revised, so confirm the current reference for your own labels at an official source rather than assuming the 50-gram figure holds everywhere. The companion below works in grams and teaspoons for exactly this reason, since those units do not depend on a labeling convention.
Serving size is the number that rescales everything
The serving size sits at the top of the panel and quietly determines every number under it, including added sugars, which makes reading it first a habit worth having. A bottle that looks like one drink is often labeled as two or two and a half servings. A bag that looks like a snack is often three. When that is the case, the added-sugars figure printed on the panel is a fraction of what is actually in the container, and multiplying is on you.
The arithmetic is trivial and the mistake is common. An added-sugars line reading 26 grams on a panel that declares two servings per container means 52 grams if the container is finished, which is 13 teaspoons. The panel is not being deceptive; it is answering the question it was asked, which was how much is in one serving. It is just answering a different question from the one most people are actually asking, which is how much is in the thing I am about to consume.
Some panels help by printing a second column for the whole container, and where that column exists it removes the arithmetic entirely. Where it does not, the two numbers to multiply are right next to each other at the top of the panel. Our nutrition label walkthrough covers the serving-size conventions in more depth, including the cases where declared servings and realistic portions diverge most.
Sugar aliases in the ingredient list
The ingredient list answers a different question from the panel: not how much, but what kind and roughly where in the ordering. Ingredients are listed by weight, heaviest first, so a sugar appearing near the top means there is a lot of it relative to everything else. The complication is that sugar appears under many names, and a product using three different sweeteners can have each of them fall lower in the list than a single sweetener would have.
The names worth recognizing include sucrose, glucose, fructose, dextrose, maltose, lactose, high-fructose corn syrup, corn syrup, cane sugar, cane juice, invert sugar, molasses, honey, maple syrup, agave nectar, malt syrup, rice syrup, and fruit juice concentrate. The rough heuristic that anything ending in -ose is a sugar catches many of them, though not all sugars end that way and not everything ending that way is a sugar, so it is a prompt to look rather than a rule.
Where the ingredient list genuinely adds something is in the honey, syrup, and juice-concentrate cases, which are sugars that carry a wholesome connotation and are counted as added sugars on the panel regardless of that connotation. Seeing them named makes the panel figure make sense. Where the ingredient list adds less is in judging quantity, since order-by-weight is coarse and the added-sugars line already gives you the exact figure. Read the panel for how much, and the ingredient list for what and why.
Do sweeteners and sugar alcohols count as added sugar?
This question comes up constantly once someone starts reading the added-sugars line, and the labeling answer is clean even though the broader question is not. Non-sugar sweeteners such as aspartame, sucralose, saccharin, acesulfame potassium, and steviol glycosides are not sugars, so they are not counted in Total Sugars or in Added Sugars. They appear in the ingredient list instead. Sugar alcohols such as erythritol, xylitol, sorbitol, and maltitol are likewise not counted as sugars, and on panels carrying the format they may be declared on their own line.
The consequence for the arithmetic in this review is narrow and worth stating plainly: the added-sugars line measures added sugar, not sweetness. A product sweetened with non-sugar sweeteners can post zero added sugars and still taste sweet, so a low figure answers the question the ceilings ask without answering every question a person might have about a product.
Beyond that labeling fact, this review takes no position. Which sweeteners are approved, at what levels, and how they must be declared is set by food-safety authorities, differs by jurisdiction, and changes over time, so the current position is a matter for an official source rather than an article. Whether any of them suits a particular person is a matter for that person and a qualified professional. What can be said without hedging is the arithmetic: they do not enter the added-sugars figure, and therefore they do not enter the gram totals this review converts.
Fruit, juice, and dried fruit: which line each lands on
Three related foods land on three different places in this framework, and separating them clears up a lot. Whole fruit carries naturally occurring sugar plus fiber and water; it posts total sugars and no added sugars, and the ceilings in this review are not written about it. Unsweetened juice carries the same naturally occurring sugar with most of the fiber removed and the volume reduced; by the labeling rule it also posts no added sugars, though its practical behavior as a drink is why it is usually discussed with sweetened drinks. Dried fruit carries the same natural sugar concentrated by the removal of water, with the fiber retained, so a small handful contains what a much larger volume of fresh fruit would.
The cases that do add up on the added-sugars line are the sweetened versions of each: juice drinks with sugar added, fruit canned in syrup, and dried fruit that has been sweetened, which some varieties are. Those are labeling questions with labeling answers, readable on the panel, and they are the reason it is worth checking rather than assuming based on the food category.
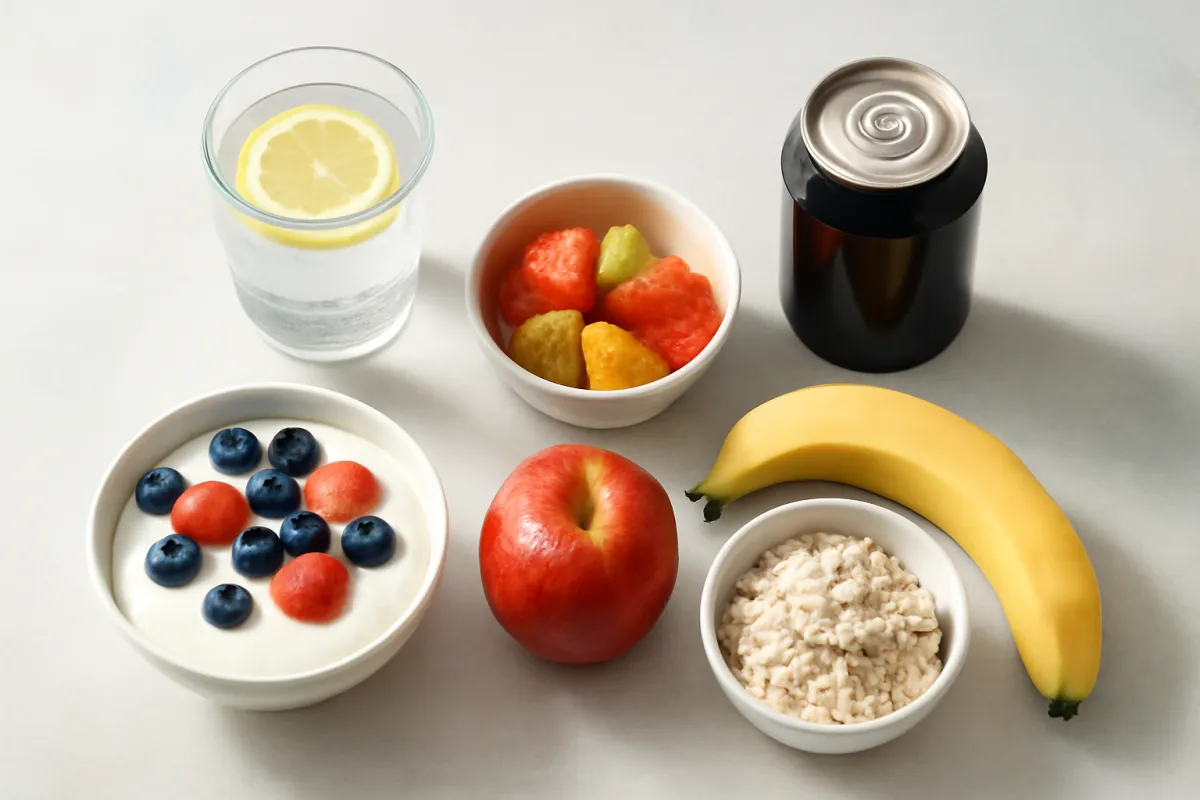
What makes this section worth its space is that fruit is where sugar arithmetic most often gets misapplied. The ceilings are written for added sugar, the panel prints added sugar separately, and whole fruit posts nothing on that line. Reporting that accurately is not an endorsement or a recommendation about how much fruit anyone should eat, which is not something this review has any business saying. It is simply where the accounting puts it.
Why the guidance is a ceiling and not a target
One structural point is easy to miss and changes how the numbers should be read: added sugar has no reference intake to reach. There is no recommended dietary allowance for it, no adequate intake, no minimum. That makes it unlike fiber, protein, or the vitamins, where the published figures describe an amount to attain and falling short is the thing being measured. With added sugar, the published figures describe an amount to stay under, and zero is a perfectly ordinary place to be.
Reading 25 or 36 grams as a daily allowance to spend gets the intent backwards. Nothing in the guidance suggests climbing toward the figure, and there is no shortfall to make up on a day that lands well below it. The number is a line, and the only direction that carries any meaning is under it.
This matters practically because it changes what the arithmetic is for. You are not budgeting toward a total the way you might with protein grams; you are checking whether a total has been exceeded and, if so, by how much and from where. That is a subtraction problem rather than an addition problem, which is why the most useful single output of any sugar calculation is not the total itself but the largest contributor to it. The companion below is built around that reading: it shows the ceiling as a line and the per-drink figure as the item most likely to cross it.
Lower-added-sugar defaults and the grams they move
If the arithmetic is a subtraction problem, the useful question is which subtractions are large. That is answerable in grams without giving anyone advice about what to eat. The largest single subtractions available in an ordinary day are, in order of grams: replacing a sweetened drink with an unsweetened one, which removes the whole of that drink’s figure and is typically the biggest number on the list; choosing a plain version of a flavored dairy product and adding fruit, which removes the difference between the two panels; and choosing lower-added-sugar versions of the repeated savory items, which removes a few grams at a time but repeats.
Ranking them this way is arithmetic rather than a recommendation, and the ranking follows directly from the ordering in the chart earlier. Nothing about it says anyone should make any of these changes, and this review has no view on what belongs in anyone’s diet. What it can say is that if a person has decided to move a daily added-sugar total, the drinks line is where the largest single number sits, and working down the list in gram order is more efficient than working in any other order.
The one genuinely useful non-numeric observation is about repetition. A change to something bought weekly repeats without further effort, while a change to something occasional does not, so the arithmetic favors the repeated items even when their per-item figures are smaller. Our grocery list walkthrough covers making those decisions at the shelf, where they only have to be made once.
A worked example: one day converted into grams and teaspoons
Here is the full conversion applied to one illustrative day at 2,000 calories, chosen to show the arithmetic rather than to describe anyone’s eating. Every figure is a typical range midpoint, not a measurement of a real product, and every step can be redone on paper.
The day’s added-sugar items are a flavored yogurt with a sweetened granola at breakfast, together about 20 g; a flavored coffee drink mid-morning, about 15 g; a sandwich on a sweetened bread with a sweetened sauce at lunch, about 8 g; a regular sweetened soft drink with lunch, about 39 g; and a cereal bar in the afternoon, about 10 g. The tally is 20 plus 15 plus 8 plus 39 plus 10, which is 92 grams of added sugar.
Now the three conversions. In teaspoons, 92 divided by 4 is 23 teaspoons. As a share of calories, 92 grams times 4 calories per gram is 368 calories, and 368 divided by 2,000 is 18.4 percent of the day’s intake. Against the ceilings, 92 grams is 67 grams above the 25-gram figure, 56 above the 36-gram figure, and 42 above the 50-gram figure that 10 percent of 2,000 calories produces.
The composition is the part worth reading. The two drinks alone are 39 plus 15, which is 54 grams, or about 59 percent of the day’s total, and 13.5 teaspoons on their own. That is well above the roughly 45 percent share in the reference shape earlier, which simply means this illustrative day is drink-heavy compared with the general pattern. Remove those two items and the day is 38 grams, or 9.5 teaspoons, or 7.6 percent of calories: under the 50-gram mark, though still just above the 36-gram figure. Change the breakfast to plain yogurt with unsweetened grain flakes and fruit, taking that item from about 20 g to about 4 g, and the day is 22 grams, 5.5 teaspoons, and 4.4 percent of calories, which is under every framing cited here.
What the example demonstrates is a property of the arithmetic, not a plan for anyone. Two items out of five carried more than half the total, so the total was dominated by the two largest numbers rather than by the count of items. That is the general shape of added-sugar arithmetic and the reason the largest contributor is the number worth identifying first. Run your own version in the companion below, which performs exactly these steps on figures you supply.
Common mistakes with daily sugar numbers
A handful of recurring errors account for most of the confusion in this topic, and each is a bookkeeping slip rather than anything deeper.
- Reading Total Sugars instead of Added Sugars. The top line combines natural and added; the indented line beneath it is the one the ceilings are written about, and the gap between them is often the most informative thing on the panel.
- Quoting grams without a calorie level. Sixty grams is 12 percent of a 2,000-calorie day and 8 percent of a 3,000-calorie one. A gram figure with no calorie figure attached cannot be interpreted at all.
- Skipping the serving size. A panel figure multiplied by two or three servings per container is a completely different number, and the two figures needed for that multiplication sit next to each other at the top.
- Treating the ceiling as a target. There is no reference intake to reach for added sugar, so the number is a line to stay under rather than an allowance to spend, and landing far below it is unremarkable.
- Assuming a category figure applies to a product. The spread within categories such as cereals, sauces, and yogurts is wider than the spread between them, so the only figure that describes what you bought is the one on what you bought.
- Counting many small items while ignoring one large one. The arithmetic is usually dominated by the largest single contributor, so identifying that item answers more than tallying everything else.
- Treating any of the published figures as fixed. Reference points are set by guidance bodies, differ between countries, and are revised, which is why the conversions in this review are the durable part and the numbers being converted are not.
A quick daily sugar checklist
The whole of this review compresses into a short routine that works at a shelf or a table.
- Know both framings, roughly 25 grams a day for women and 36 for men, or under 10 percent of calories, which is calories times 0.10 divided by 4.
- Divide grams by four to get teaspoons, in both directions, on any figure you meet.
- Multiply grams by four to get calories, then divide by your daily calories, to see any figure as a share of intake.
- Read the serving size first, then the Added Sugars line, then the percent daily value against its roughly 50-gram reference.
- Check the four or five repeated items you buy most often once, rather than reading every panel every time.
- Identify the largest single contributor before tallying anything else, since it usually dominates the total.
- Confirm the current published figures at an official source, and confirm anything about your own body with a qualified professional.
Run your own day through the companion below to see the tally, the teaspoon conversion, and the percentage together.
The bottom line
How much sugar per day comes down to one distinction and two conversions. The distinction is that the commonly cited ceilings are written for added sugar, the sugar put into a food, and not for the naturally occurring sugar in whole fruit and plain milk, which is why nutrition panels print the two on separate lines. The conversions are that about 4 grams of sugar is 1 teaspoon, so 25 grams is 6.25 teaspoons and 36 grams is 9, and that sugar supplies about 4 calories per gram, so the under-10-percent framing is calories times 0.10 divided by 4, landing near 50 grams on a 2,000-calorie day and scaling from about 38 grams at 1,500 calories to 75 at 3,000. Added sugar accumulates unevenly, with sweetened drinks typically carrying the largest single share, which is why identifying the biggest contributor answers more than counting everything. The published figures themselves are population reference points that get revised and differ between countries, so confirm them at an official source; the arithmetic is what stays true. For the wider carbohydrate picture see our carbs per day evidence review, and for the label process step by step see our walkthrough of spotting hidden sugar on food labels.
NourishMark publishes this evidence review for general education only. It reports what commonly cited public-health reference points for added sugar say and shows the arithmetic that converts them between grams, teaspoons, and percent of calories; it does not diagnose, treat, or advise, and it is not medical, nutritional, or dietary advice for any reader. Reference intakes and label rules are set by dietary guidance bodies and regulators, differ between countries, and are revised over time, so verify any figure quoted here against the current official publication for your country before relying on it. Food amounts are typical ranges given to demonstrate the conversions, never measurements of a named product, and the only accurate figure for anything you buy is the added-sugars line on that item. For any question about your own diet, health, medication, or a condition affecting how you should eat, speak with a doctor or registered dietitian who can consider your full circumstances.
Frequently asked questions
What is the amount of sugar recommended per day?
The figure dietary guidance puts a ceiling on is added sugar, and two framings are commonly cited. The American Heart Association points to keeping added sugar under about 25 grams a day for most women and about 36 grams a day for most men. The Dietary Guidelines for Americans, published jointly by the USDA and HHS, keep added sugar under 10 percent of daily calories, which at 4 calories per gram works out to about 50 grams on a 2,000-calorie day and scales up or down with how much you eat. The World Health Organization sets a comparable 10 percent limit on free sugars, with a further conditional suggestion of under 5 percent. Naturally occurring sugar in whole fruit and plain milk is not what any of these target. These are population reference points that get revised rather than personal targets, so confirm current figures with the body that publishes them and anything specific to you with a doctor or registered dietitian.
Which organizations publish a daily sugar limit, and do they agree?
Three are cited most often and they do not fully agree, which is worth knowing before quoting any single number. The American Heart Association publishes a flat daily maximum for added sugar, stated as calories and converted to about 25 grams for most women and about 36 grams for most men. The Dietary Guidelines for Americans, from the USDA and HHS, publish a share of calories rather than a flat figure: added sugars under 10 percent of daily calories. The World Health Organization publishes a 10 percent limit too, but on free sugars, a slightly wider category that also counts the sugars in honey, syrups, and fruit juice, plus a conditional suggestion that going under 5 percent may add benefit. The disagreement is not a flaw in the evidence so much as different committees drawing a line in slightly different places on the same picture, and each figure is periodically reviewed, so check the current wording at the publishing body rather than in any article.
Is there a recommended amount of total sugar per day?
No widely cited body publishes a daily ceiling on total sugars, and that gap is deliberate rather than an oversight. Total sugars on a nutrition panel combine the sugar that was put into a food with the sugar that was already there, so a single ceiling drawn across both would count the lactose in plain milk and the fructose in whole fruit against the same line as the sugar in a soft drink. Every daily figure quoted in this review is written for added sugars, or in the World Health Organization framing for free sugars. That is why a panel prints Added Sugars as its own indented line beneath Total Sugars, and why a high total-sugars figure with a zero added-sugars figure beneath it is not something the published limits speak to at all.
How many grams of sugar per day is that in teaspoons?
The conversion everyone actually needs is that roughly 4 grams of sugar is about 1 teaspoon, so you divide the grams by four. Run the two commonly cited ceilings through it and 25 grams becomes 6.25 teaspoons, which is where the familiar about 6 teaspoons figure comes from, and 36 grams becomes exactly 9 teaspoons. The under-10-percent version at 2,000 calories, roughly 50 grams, becomes 12.5 teaspoons. The same division works on any nutrition panel: an added-sugars line reading 39 grams is 9.75 teaspoons, and one reading 12 grams is 3 teaspoons. This is arithmetic you can redo on paper rather than a figure to take on trust, and the underlying gram-per-teaspoon value is a rounded convention, not a precise measurement.
What is the difference between added sugar and naturally occurring sugar?
Added sugar is sugar or syrup put into a food or drink during processing, cooking, or at the table, which covers the sugar in soft drinks and sweets as well as the sugar stirred into sauces, dressings, flavored yogurt, cereals, and many breads. Naturally occurring sugar is the sugar already present in a whole food, chiefly the fructose in fruit and the lactose in milk and plain yogurt, and it arrives packaged with fiber, water, protein, or micronutrients depending on the food. The commonly cited daily ceilings are written for added sugar only. That distinction is why a nutrition panel prints an Added Sugars line separately underneath Total Sugars, and it is the single most useful thing to understand before any gram figure means anything.
Does the sugar in fruit count toward the daily sugar limit?
The sugar in whole fruit is naturally occurring, so it is not what the added-sugar ceilings are written about, and it shows up in the Total Sugars line on a panel without appearing in the Added Sugars line beneath it. Fruit juice is the case that splits opinion in practice: the sugar in unsweetened juice is still naturally occurring by definition, so it also does not appear as added sugar on a panel, but it arrives without the fiber of the whole fruit and in a form that is quick to drink, which is why it is usually discussed alongside sweetened drinks rather than alongside fruit. Dried fruit concentrates the same natural sugar into a smaller volume as water leaves. Any sugar added to a juice, a canned fruit syrup, or a sweetened dried fruit does count as added sugar and is listed as such.
How do you work out 10 percent of your calories in grams of sugar?
Take your usual daily calories, multiply by 0.10, and divide by 4, because sugar supplies about 4 calories per gram. On 2,000 calories that is 200 calories divided by 4, which is 50 grams. The same arithmetic gives roughly 38 grams at 1,500 calories, 45 grams at 1,800 calories, 55 grams at 2,200 calories, 63 grams at 2,500 calories, and 75 grams at 3,000 calories. Dividing any of those by four again converts it to teaspoons, so the 2,000-calorie figure is 12.5 teaspoons. Going the other direction works too: multiply your added-sugar grams by 4 and divide by your calories to see what share of your intake they represent. These are conversions of a commonly cited reference point that is periodically revised, not a personal target.
Where does added sugar come from in a normal day?
The pattern usually described is that sweetened drinks carry the largest single share, sweets and desserts come next, and a long tail sits inside everyday savory items that nobody thinks of as sugary, such as bread, pasta sauce, ketchup, salad dressing, breakfast cereal, granola, and flavored yogurt. Drinks lead for a structural reason rather than a mysterious one: a single sweetened drink can carry more grams than a whole afternoon of small hidden sources, and it takes about a minute to finish. The exact split varies by country, by survey, and by person, so treat any breakdown as a reference shape for deciding where to look first, not a measurement of your own day. Your own split is visible from the Added Sugars line on the things you buy repeatedly.
How do you find added sugar on a nutrition label?
On panels that carry the format, look under Total Sugars for an indented Added Sugars line, usually written as Includes X g Added Sugars, with a percent daily value beside it. That percent is calculated against a reference of 50 grams a day, the 10 percent of 2,000 calories figure, so 20 percent daily value means 10 grams. Check the serving size first, because a bottle or bag that reads as one portion is often two or three servings and every number on the panel multiplies with it. Dividing the added-sugar grams by four converts them to teaspoons. Panel formats and reference values differ between countries and are revised over time, so confirm the current rules for your own labels at an official source. Our step-by-step walkthrough of spotting hidden sugar on labels covers the process in more detail.
Do sweeteners and sugar alcohols count as added sugar?
Non-sugar sweeteners such as aspartame, sucralose, saccharin, and steviol glycosides are not sugars, so they are not counted in the Total Sugars or Added Sugars lines on a nutrition panel, though they do appear in the ingredient list. Sugar alcohols such as erythritol, xylitol, sorbitol, and maltitol are also not counted as sugars, and on panels that carry the format they may be listed on their own line. The practical consequence for the arithmetic in this review is that a product sweetened this way can show a low or zero added-sugars figure while still tasting sweet, so the added-sugars line answers a narrower question than how sweet something is. Which sweeteners are approved, and how they must be declared, is set by food-safety authorities and changes over time, so check the current position at an official source.

Hamza Hai is the editor of NourishMark. She holds an MBA and reviews the site's articles against our editorial standards, checking that every figure is labelled for what it is, that nothing is presented as verified fact without a source the reader can check, and that the writing stays useful to a non-specialist.

Dr. Shayaan Khan is the medical reviewer for NourishMark. He holds an MBBS from MGM Medical College, Navi Mumbai, and is the author of published research including a narrative review of postpartum anxiety and depression in Mental Health Science. He has taught physiology at university level. He reviews the site's health content for medical accuracy: that physiology and mechanisms are described correctly, that no claim is stated more strongly than the evidence behind it, and that anything specific to an individual reader is sent to that reader's own clinician.
Not medical advice. Dr. Khan reviews NourishMark's health content for medical accuracy. He is not a registered dietitian, he does not hold a United States practising licence, and he is not your doctor. His review does not make anything here medical advice. Always talk to a qualified health professional about your own situation, and never delay or stop care because of something you read here.