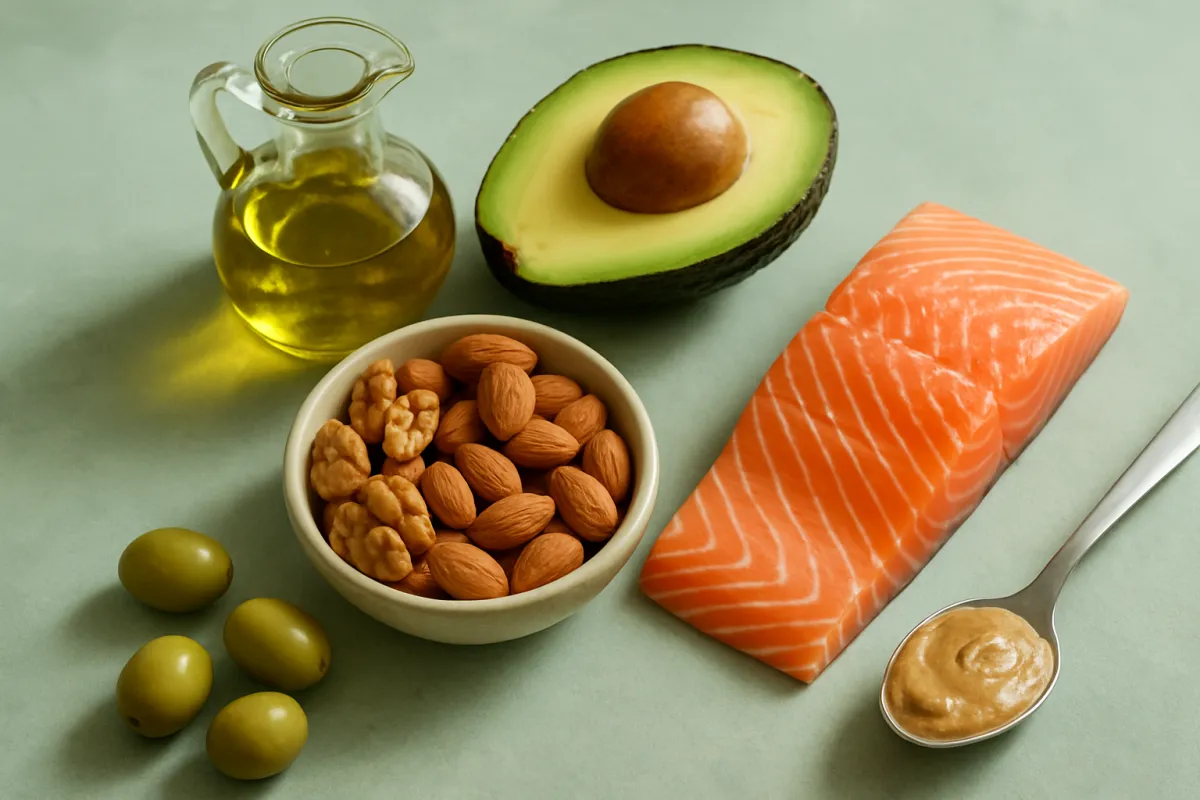
What's in this review
- How much fat per day: the commonly cited range
- Why fat is set as a percentage of calories, not a gram number
- Fat is 9 calories per gram: the math
- Fat grams by calorie target
- Why fat is the easiest macro to under-count
- The types of fat, and why the split matters
- Saturated fat: where it comes from and the commonly cited ceiling
- Unsaturated fat: monounsaturated and polyunsaturated
- Omega-3 and the essential fatty acids
- Trans fat, and why it mostly left the shelf
- What happens when fat goes too low
- Fat-soluble vitamins need fat to be absorbed
- How fat targets shift on a low-carb pattern
- Fat and satiety: why the number is not the whole story
- Reading total fat on a nutrition label
- Serving sizes and the oil you never measured
- Fat in common foods, in grams
- Cooking oils and how much you actually use
- A worked example: a 2,000-calorie day
- Spreading fat across meals
- How fat fits with protein and carbs
- Conditions where fat intake is managed differently
- Common mistakes with daily fat
- A quick daily fat checklist
- The bottom line
How much fat per day? The short answer: general guidance commonly puts fat at 20 to 35 percent of daily calories, and because fat carries about 9 calories per gram, that works out to roughly 44 to 78 grams on a 2,000-calorie day, with the calculator alongside converting your own calorie level into the same range. Fat is the macronutrient that gets the least clear public answer. Protein has a gram-per-kilogram figure people can repeat, carbohydrate has a percentage that at least sounds like a rule, and fat has spent forty years being either the villain of every diet or the hero of every diet, depending on which decade you ask. The actual guidance sits quietly in the middle, expressed in a form almost nobody translates into food.
This evidence review is a plain-language reference for daily fat. It answers the direct question first, explains why fat is set as a percentage of calories rather than a flat gram number, converts that percentage into grams at every common calorie target, and then covers the parts that matter more than the total: the 9-calories-per-gram density that makes fat so easy to under-count, the saturated and unsaturated split, omega-3 and the essential fatty acids, what happens when fat goes very low, how the target shifts on a low-carb pattern, how to find fat on a label, and what an ordinary day at the target actually looks like. It is general information describing commonly cited figures, not medical or dietary advice. For the neighbouring macronutrients, see our carbohydrate evidence review and our protein evidence review, and run your own calorie level through the companion below.
Key takeaways
- Fat is commonly cited at roughly 20 to 35 percent of daily calories, which at about 9 calories per gram works out to roughly 44 to 78 grams on a 2,000-calorie day. These are population reference figures, not personal targets.
- Fat is expressed as a share of calories because the sensible amount depends entirely on how much you eat in total, so the same percentage produces very different gram counts at 1,600 and at 3,000 calories.
- At about 9 calories per gram, fat is more than twice as energy-dense as protein or carbohydrate, which is why a tablespoon of oil is roughly 14 grams of fat and why unmeasured cooking oil is the most commonly under-counted thing on a plate.
- Composition draws more attention than the total: build most of it from unsaturated sources, keep saturated fat under roughly 10 percent of calories (about 22 grams at 2,000 calories), and keep trans fat near zero.
- Very low fat intake has costs, because vitamins A, D, E and K are absorbed alongside fat and two fatty acids are essential, so a low-fat pattern is not automatically a better one. Confirm your own numbers with a doctor or registered dietitian.
How much fat per day: the commonly cited range
The figure most general dietary guidance settles on is a range rather than a number, and it is a range of percentages rather than of grams: roughly 20 to 35 percent of total daily calories from fat. That band is wide on purpose. It is drawn to describe an entire adult population rather than one person, and it accommodates eating patterns that look nothing like each other, from a very plant-heavy plate at the low end to a Mediterranean-style plate rich in olive oil, nuts and fish nearer the top.
Converted at about 9 calories per gram, the band lands between roughly 44 and 78 grams a day for someone eating 2,000 calories. That is a spread of about 34 grams, which in food terms is around two and a half tablespoons of oil, so it is a genuinely loose target rather than a tightrope. Most people eating an ordinary mixed diet land somewhere inside it without trying.
Two things follow from that width. First, being a little above or below on a given day is unremarkable, because the range itself is an average-over-time idea. Second, the interesting questions are not really about the total at all. They are about which fats make up the total, and whether the fat you are counting is the fat you are actually eating. Both get their own sections below.
Why fat is set as a percentage of calories, not a gram number
Fat is one of three macronutrients that supply calories, so any sensible fat figure has to sit in proportion to the other two. If guidance handed out a flat gram number, it would be wrong for almost everyone. Seventy grams of fat is about 30 percent of a 2,000-calorie day and a reasonable middle of the road figure. The same 70 grams on a 1,400-calorie day is 45 percent of the total, which crowds protein and carbohydrate into a very small remaining space. On a 3,200-calorie day it is under 20 percent, at the very bottom of the range.
Percentages solve that by scaling automatically. One range describes a small older adult eating 1,500 calories and a tall active person eating 3,200, and in both cases the three macronutrients stay in proportion. This is the same logic behind the carbohydrate and protein ranges, which is why all three are usually published together as a set that adds to 100 percent.
The cost of the percentage approach is that a percentage is unusable in a kitchen. Nobody stands at the counter thinking in shares of daily energy. That translation step, percentage into grams, is where most people give up, and it is the single job the companion below is built to do. Our macro calculation walkthrough covers the same conversion for all three macronutrients at once.
Fat is 9 calories per gram: the math
Every conversion in this evidence review runs on one constant. Fat supplies about 9 calories per gram, against about 4 calories per gram for both protein and carbohydrate. That single fact does more work than any other number in the topic.
The arithmetic is two steps. Multiply your daily calories by the fat percentage you want to check, which gives calories from fat, then divide by 9, which gives grams. At 2,000 calories and 30 percent: 2,000 times 0.30 is 600 calories from fat, and 600 divided by 9 is about 67 grams. At the bottom of the range, 2,000 times 0.20 is 400 calories, divided by 9 is about 44 grams. At the top, 2,000 times 0.35 is 700 calories, divided by 9 is about 78 grams.
Running the arithmetic backwards is just as useful for reading labels. A food with 10 grams of fat is carrying about 90 calories from fat alone. A tablespoon of oil at roughly 14 grams is about 126 calories, essentially all of it fat. A quarter of a medium avocado at roughly 7 grams of fat contributes about 63 calories from its fat.
Because the multiplier is 9 rather than 4, the same visual quantity of fat is more than double the calories of the same quantity of carbohydrate. That asymmetry is the root of everything in the under-counting section further down.
Fat grams by calorie target
Here is the conversion applied across the calorie levels most adults fall between. Every figure is the commonly cited percentage applied to the calorie level and divided by 9, rounded to the nearest gram.
At 1,500 calories: about 33 grams at 20 percent, about 50 grams at 30 percent, and about 58 grams at 35 percent. At 1,600 calories: about 36, 53 and 62 grams. At 1,800 calories: about 40, 60 and 70 grams. At 2,000 calories: about 44, 67 and 78 grams. At 2,200 calories: about 49, 73 and 86 grams. At 2,500 calories: about 56, 83 and 97 grams. At 2,800 calories: about 62, 93 and 109 grams. At 3,000 calories: about 67, 100 and 117 grams.
Read the middle column as an unremarkable default and the outer two as the edges of normal rather than as pass and fail marks. Notice also that the 3,000-calorie low end, about 67 grams, is exactly the 2,000-calorie middle. Two people can eat the same gram total and sit at opposite ends of the range, which is the clearest possible argument for knowing roughly what your own calorie level is. Our calorie needs review covers how that figure is estimated.
Illustrative daily fat grams by calorie level
Fat grams at a middle-of-the-range share of about 30 percent of calories, by daily calorie level, at 9 calories per gram. Illustrative population figures, not personal targets.
Bars scale to the 3,000-calorie figure at 100 percent. Values are illustrative grams at a 30 percent fat share; the full 20 to 35 percent range spreads wider at every level, and individual needs vary. Confirm your own with a professional.
Why fat is the easiest macro to under-count
Ask someone to picture 60 grams of chicken breast and they picture a small piece of chicken. Ask them to picture 60 grams of fat and most people picture nothing at all, because fat rarely appears as an object on a plate. It is absorbed into the food while it cooks, whisked into a dressing, folded into pastry, or already inside the meat before it reaches the pan.
The energy density compounds the invisibility. A tablespoon of oil is roughly 14 grams of fat, about a fifth of a middling 67-gram day. A confident pour into a hot pan is easily two tablespoons, which is 28 grams and over 250 calories before a single ingredient goes in. Two tablespoons of a creamy dressing on a salad can add a similar amount. Neither looks like much, and neither registers as a food anyone would think to write down.
There is a simple corrective that does not require permanent tracking. Measure your cooking oil with an actual spoon for three or four ordinary days, not to change anything, just to see the number. Most people find the gap between their estimate and the measurement is larger than anything else in their diet. After that, the estimate recalibrates and you can go back to pouring.
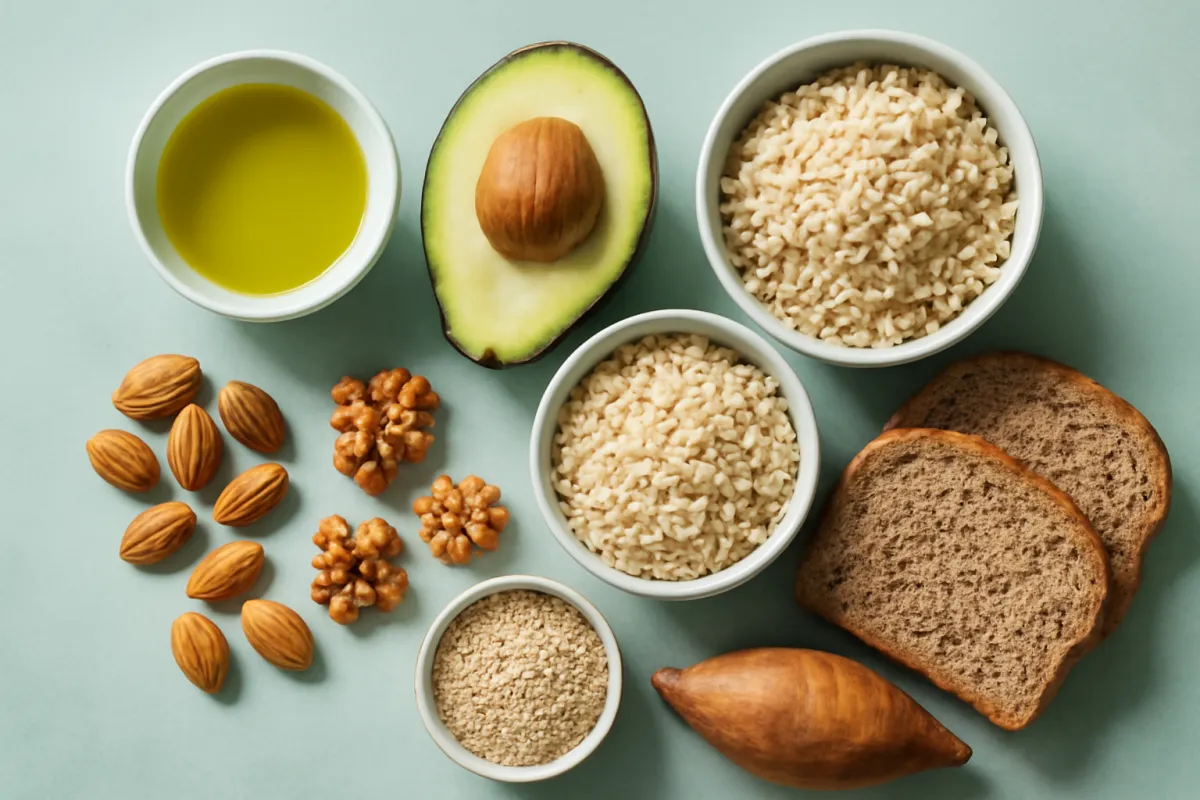
The types of fat, and why the split matters
Dietary fat is not one substance. It is a family of fatty acids that differ in their chemical structure, and general dietary guidance pays more attention to the mix than to the total for anyone already inside the 20 to 35 percent range.
The everyday categories are three. Unsaturated fats, which divide further into monounsaturated and polyunsaturated, are liquid at room temperature and come mainly from plants and fish. Saturated fats are solid or semi-solid at room temperature and come mainly from animal foods plus a few tropical plant oils. Trans fats are a small third category, mostly produced industrially, and general guidance treats them as something to keep as close to zero as practical.
Almost no real food is purely one type. Olive oil is predominantly monounsaturated but carries a meaningful saturated fraction. Butter is predominantly saturated but is not entirely so. Salmon carries all three unsaturated families alongside some saturated fat. This is why food-level advice, eat more fish and nuts, use liquid plant oils, go easier on butter and fatty processed meat, ends up being more usable than fatty-acid-level arithmetic.
The practical shape most guidance describes is straightforward: most of your fat unsaturated, saturated held under roughly a tenth of calories, trans fat near zero. The chart below puts illustrative numbers on that shape.
An illustrative shape for a day's fat, by type
How a 67-gram fat day at 2,000 calories could divide across the three families. Shares sum to 100 percent and describe a reference shape, not a rule.
The saturated segment is drawn at its ceiling rather than as a quota: about 20 grams is roughly 180 calories, close to 9 percent of a 2,000-calorie day and just under the commonly cited 10 percent figure. A day built mostly on oils, nuts, seeds and fish usually lands well below that segment. Illustrative reference shape only.
Saturated fat: where it comes from and the commonly cited ceiling
Saturated fat is the fraction general dietary guidance puts an explicit ceiling on rather than a range around. The commonly cited figure is to keep it below about 10 percent of total daily calories, which at 2,000 calories is roughly 22 grams. United States nutrition labels use a slightly rounder reference Daily Value near 20 grams against the same 2,000-calorie reference, so you will see both numbers and they sit close enough together that the distinction rarely matters in practice.
Where it comes from is easy to remember because the sources cluster. Dairy fat, meaning butter, cream, full-fat cheese and full-fat milk, is one cluster. Fatty cuts of meat and processed meats are another. Coconut oil and palm oil are the plant exceptions, both high in saturated fat despite being plant foods. And a great deal of it arrives inside packaged baked goods, pastry, fried takeaway food and confectionery, where it is neither visible nor written down.
Twenty-two grams is not a large allowance in food terms. An ounce of cheddar is roughly 9 grams of total fat with about 6 of those saturated. A tablespoon of butter is roughly 12 grams total with around 7 saturated. Two of each and most of the day’s ceiling is gone before dinner. This is a reference figure for a population, not a personal limit, and anyone managing cholesterol or cardiovascular risk should have their target set by a clinician rather than by an article.
Unsaturated fat: monounsaturated and polyunsaturated
Unsaturated fats are the fraction most general guidance suggests building the bulk of your total from. They are liquid at room temperature, which is a genuinely useful shortcut: if a fat pours, it is mostly unsaturated, and if it sits solid on the counter, it is mostly saturated. The tropical oils are the exception that proves the rule.
Monounsaturated fats dominate olive oil, canola oil, high-oleic sunflower oil, avocado, almonds, cashews, peanuts and most nut butters. They are the workhorse category in Mediterranean-style eating patterns and are usually the largest single slice of the fat in a plant-forward diet, which is why the illustrative shape above draws them at about 45 percent of the total.
Polyunsaturated fats split into two families, omega-6 and omega-3, and are found in oily fish, walnuts, flaxseed, chia, hemp, sunflower seeds, and soybean and sunflower oils. Both families contain a fatty acid the body cannot make for itself, which is what puts them in a category of their own.
The practical translation is not complicated. Cook with liquid plant oils rather than solid fats most of the time, keep nuts or seeds somewhere you actually reach for them, include oily fish if you eat fish, and let avocado do the job mayonnaise was doing. Our avocado calorie breakdown shows how much fat a single one carries, which is a useful anchor because it is a lot more than most people assume.
Omega-3 and the essential fatty acids
Two fatty acids are described as essential in the strict nutritional sense: the body cannot manufacture them from anything else, so they have to arrive in food. They are linoleic acid, an omega-6 polyunsaturated fat, and alpha-linolenic acid, an omega-3 polyunsaturated fat. Commonly cited adequate intake figures put linoleic acid in the low teens of grams a day and alpha-linolenic acid at somewhere around one to two grams, with the exact reference figures differing by sex and age.
Linoleic acid is easy to meet. It is abundant in ordinary vegetable oils, nuts and seeds, and most people eating a mixed diet take in plenty without thinking about it. Alpha-linolenic acid is the one that takes a little intention, and it concentrates in a short list: walnuts, flaxseed and flax oil, chia seeds, hemp seeds and canola oil.
The longer-chain omega-3 fatty acids found in oily fish, usually abbreviated EPA and DHA, are a related but separate matter. The body can convert some alpha-linolenic acid into them, though the conversion is generally described as limited, which is the usual reasoning behind guidance to eat oily fish a couple of times a week rather than relying on plant sources alone. Salmon, sardines, mackerel, herring and trout are the common examples.
None of this is a treatment claim. Omega-3 is a nutrient with an established dietary role, not a remedy, and supplement decisions in particular belong with a clinician, especially alongside blood-thinning medication.
Trans fat, and why it mostly left the shelf
Trans fat is the one category general dietary guidance treats as having no useful place in the diet rather than an acceptable range. Small amounts occur naturally in dairy and meat, but the type that attracted regulatory attention was the industrially produced kind created by partially hydrogenating liquid oils to make them solid and shelf-stable.
Over the past two decades, regulators in many countries have moved to restrict or eliminate partially hydrogenated oils from the food supply, and manufacturers have reformulated in response. The practical result is that trans fat is far less common in packaged food than it was, and in many markets it is genuinely difficult to find in meaningful quantities.
Two things are worth knowing anyway. First, labelling rules in some markets allow a product to declare zero trans fat if the amount per serving falls below a small threshold, so several servings of several such products can add up to more than the label suggests. Second, the ingredient list is the more reliable signal: the phrase “partially hydrogenated” in an ingredient list means the fat is there regardless of what the panel says. Our nutrition label walkthrough covers that panel-versus-ingredients distinction in more detail.
Because the exact rules and thresholds differ by country and change over time, treat the specifics above as a mechanism to understand rather than a current regulation to quote, and check your own market’s food agency for the rule in force.
What happens when fat goes too low
The low-fat era left a residue of belief that less fat is always better, and the 20 percent floor at the bottom of the commonly cited range exists precisely because that is not so. Fat is doing work that its calorie count does not describe.
The clearest mechanism is absorption. Vitamins A, D, E and K are fat-soluble, meaning they dissolve in fat rather than water and are taken up alongside dietary fat in the gut. A plate of leafy greens and carrots eaten with essentially no fat delivers less of those vitamins than the same plate with a spoonful of oil on it, which is one of the more practical reasons a salad dressed with olive oil is not a compromise.
Fat also carries the two essential fatty acids described above, contributes a great deal to how satisfying a meal feels and how long that feeling lasts, and is involved in the raw materials for a range of physiological processes including hormone production. Very low fat patterns are used clinically in a few specific circumstances, but they are a medical intervention in those cases rather than a general improvement.
The everyday version of this is simply that cutting fat to the bone tends to backfire. Meals get less satisfying, the calories usually come back somewhere else, and the diet gets harder to keep up. If you have symptoms you are worried about, that is a conversation for a clinician, not a reason to adjust a number in a calculator.
Fat-soluble vitamins need fat to be absorbed
It is worth pulling the absorption point out on its own, because it changes how you build individual meals rather than how you set a daily total. Vitamin A and its carotenoid precursors, vitamin D, vitamin E and vitamin K all travel with fat. Their uptake depends on fat being present in the same meal, not merely somewhere in the same day.
In practice that argues for small, deliberate additions rather than large ones. Olive oil or a vinaigrette on a salad. A few nuts or seeds scattered over roasted vegetables. Avocado in a sandwich instead of a low-fat spread. Vegetables roasted in a spoonful of oil rather than steamed plain. Whole eggs rather than whites alone, since the fat-soluble vitamins in an egg sit in the yolk.
The amounts involved are modest. A teaspoon of oil is around 4 to 5 grams of fat, so a teaspoon on a salad is a small fraction of a 67-gram day and does the absorption job. There is no need to drown anything, and drowning it mostly just adds calories.
This is also a decent argument against the habit of eating a very lean lunch and then loading all the day’s fat into dinner. Spreading it across meals means each meal carries some, which is better aligned with how absorption actually works. Our balanced meal method sets out a plate structure that does this without any counting.
How fat targets shift on a low-carb pattern
The 20 to 35 percent band assumes a conventional mixed diet. Change the shape of the diet and the fat share necessarily changes with it, because the three macronutrients must add to 100 percent of calories. If carbohydrate falls, the calories have to be made up by protein, fat, or both, and in practice fat absorbs most of the difference.
A moderate low-carbohydrate pattern is often described with carbohydrate near 20 percent of calories, protein near 25 to 35 percent, and fat somewhere near 45 percent. On a 2,000-calorie day, 45 percent is 900 calories from fat, which at 9 calories per gram is about 100 grams. That is well above the top of the general range, and it is arithmetic rather than a recommendation.
Ketogenic patterns push further. They are commonly described near 70 percent of calories from fat, which on the same 2,000 calories is 1,400 calories and about 156 grams. At 75 percent it is closer to 167 grams. Those numbers are startling next to the 44 to 78 gram band and illustrate how much the framing depends on the pattern rather than on any absolute truth about fat.
Two cautions apply. These are descriptions of what such patterns look like, not endorsements: low-carbohydrate and ketogenic eating carries trade-offs, is not suitable for everyone, and interacts with several medications. And a higher fat share still says nothing about composition, so the saturated and unsaturated question remains live. Our carbohydrate evidence review covers the other side of the same trade.
Fat and satiety: why the number is not the whole story
Fat slows the rate at which the stomach empties and contributes strongly to how a meal tastes and feels, which is why fat-free versions of familiar foods so often disappoint. Removing it removes a texture and a flavour carrier as well as some calories, and manufacturers commonly replace it with sugar, starch or thickeners to compensate.
That has a practical consequence for anyone thinking about the total. Fat at the bottom of the range with plenty of protein and fibre alongside can feel perfectly satisfying. Fat at the bottom of the range with refined carbohydrate alongside often does not, and the shortfall tends to be made up later. The macronutrient number on its own does not predict how a day of eating will actually go.
There is a counterweight. Because fat is 9 calories per gram, it is also the easiest way to add a lot of calories without adding much food volume, which is exactly why the range has a top end as well as a bottom. Nuts are an excellent food and an ounce is around 14 to 18 grams of fat, so a large handful eaten absently while cooking is a real contribution.
The workable middle is to put fat where it does the most work: on vegetables, in dressings, alongside protein, in the foods that carry it naturally. Our protein evidence review covers the other half of the satiety picture.
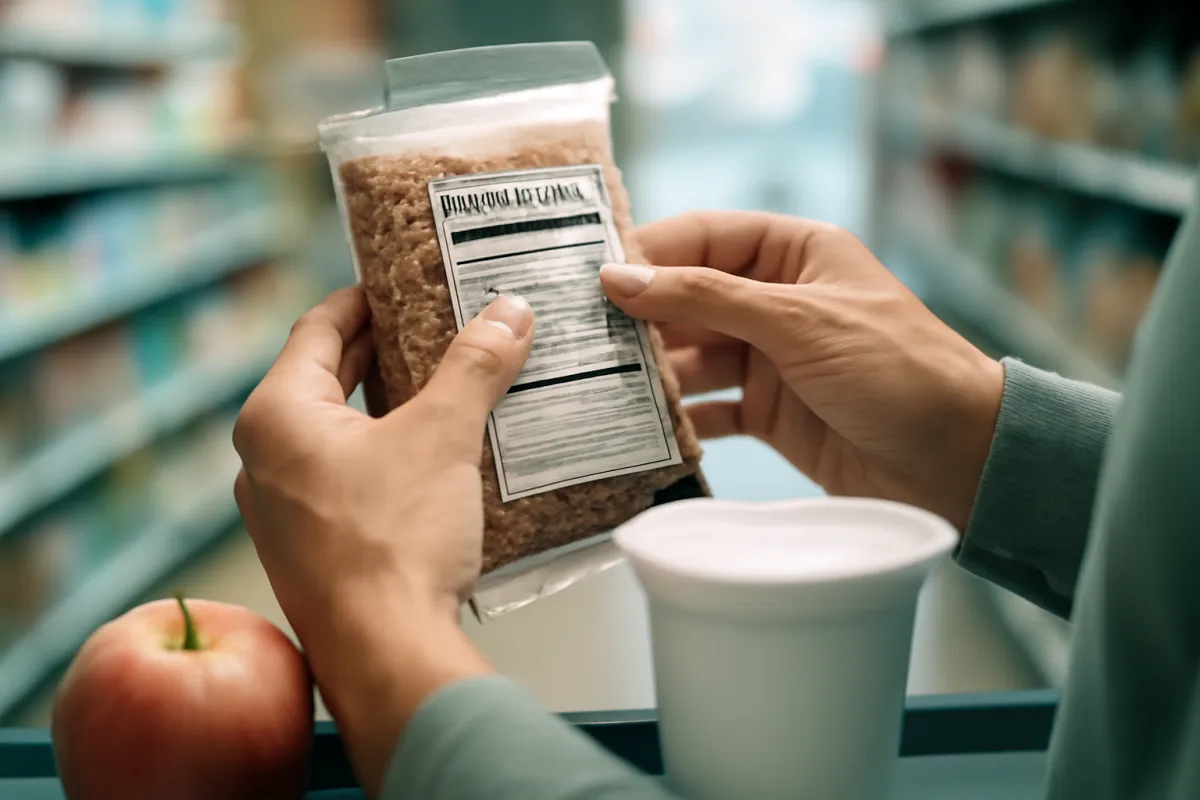
Reading total fat on a nutrition label
The fat block on a nutrition panel is near the top and usually has three lines: Total Fat, then Saturated Fat, then Trans Fat indented beneath it. Some labels add monounsaturated and polyunsaturated lines, though these are optional in many markets.
The percentage figure beside Total Fat is a percent Daily Value, and it answers a specific question: what share of a reference day this serving supplies. On United States labels that reference is built on 2,000 calories with a Daily Value near 78 grams of total fat and near 20 grams of saturated fat. Note that 78 grams is the 35 percent figure from our conversion table, so the label reference sits at the top of the commonly cited range rather than in the middle. If you eat meaningfully more or less than 2,000 calories, the percentage on the panel is not describing your day.
The commonly cited rule of thumb for reading any percent Daily Value is that around 5 percent or less per serving is a little of that nutrient and around 20 percent or more is a lot. It works as a quick sorting tool between two similar products on a shelf.
The trap is the serving size at the top of the panel, which sets everything below it. A panel showing 9 grams of fat per serving with three servings in the package describes 27 grams if you eat the package.
Serving sizes and the oil you never measured
The single largest source of error in fat estimates is not the label, it is the pour. Cooking oil is dispensed by eye, from a bottle, into a hot pan, in a hurry, and the resulting quantity is almost never the quantity anyone would have guessed.
Some anchors help. A teaspoon of oil is about 4 to 5 grams of fat. A tablespoon is about 14 grams. A quarter-cup, which is a very ordinary amount for roasting a tray of vegetables, is about 55 grams and by itself is roughly a full day at the low end of the range.
The same problem applies to spreadable and pourable fats generally. Butter on toast, mayonnaise in a sandwich, dressing on a salad, cream in a sauce, and the oil in which anything is fried all arrive in amounts nobody measured. A restaurant kitchen in particular uses considerably more fat than a home cook expects, which is a large part of why the same dish differs so much between the two.
None of this argues for weighing oil forever. It argues for weighing it briefly, once, so that the estimate you go back to is anchored to something real. Our macro counting method covers the same calibrate-then-estimate approach applied across all three macronutrients.
Fat in common foods, in grams
These are commonly cited approximate figures for ordinary portions. Real foods vary with cut, brand, ripeness and preparation, so read them as anchors rather than measurements.
Oils and spreads: one tablespoon of any liquid cooking oil is about 14 grams; one tablespoon of butter about 12 grams; one tablespoon of mayonnaise about 10 grams; two tablespoons of a typical creamy dressing about 14 to 16 grams.
Nuts, seeds and avocado: one ounce of almonds about 14 grams; one ounce of walnuts about 18 grams; two tablespoons of peanut butter about 16 grams; one tablespoon of chia seeds about 4 grams; half a medium avocado roughly 11 to 15 grams depending on size.
Animal foods: one large egg about 5 grams, essentially all in the yolk; four ounces of cooked salmon roughly 10 to 12 grams; four ounces of skinless chicken breast about 4 grams; four ounces of cooked 85 percent lean ground beef about 15 grams; one ounce of cheddar about 9 grams; one cup of whole milk about 8 grams and 2 percent milk about 5 grams.
Packaged and prepared foods: one ounce of potato chips about 10 grams; a typical croissant or pastry commonly in the high teens; fried foods vary enormously with the oil absorbed during cooking, which is exactly the fat nobody counts.
Cooking oils and how much you actually use
All liquid cooking oils are close to identical on total fat, roughly 14 grams per tablespoon, because they are essentially pure fat. Where they differ is composition and smoke point, not quantity.
Olive oil is predominantly monounsaturated and is the default in Mediterranean-style patterns. Canola oil is also largely monounsaturated and carries a useful amount of alpha-linolenic acid. Sunflower and soybean oils lean polyunsaturated and are omega-6 dominant. Coconut and palm oils are the high-saturated plant oils. Butter and ghee are dairy fats and predominantly saturated.
The swap that moves the composition needle most is replacing a solid cooking fat with a liquid plant oil for everyday cooking, while keeping butter for the occasions where it is doing something a liquid oil cannot. That is a substitution rather than a subtraction, so the total stays roughly the same and the mix changes, which is precisely the emphasis in most general guidance.
Technique changes the quantity more than the choice of oil does. Brushing or spraying rather than pouring, using a pan that does not require a flood, roasting rather than shallow frying, and tossing vegetables in a bowl with a measured spoonful rather than drizzling over a tray all cut the amount without changing the food much. None of this is prescriptive, it is simply where the grams are.
A worked example: a 2,000-calorie day
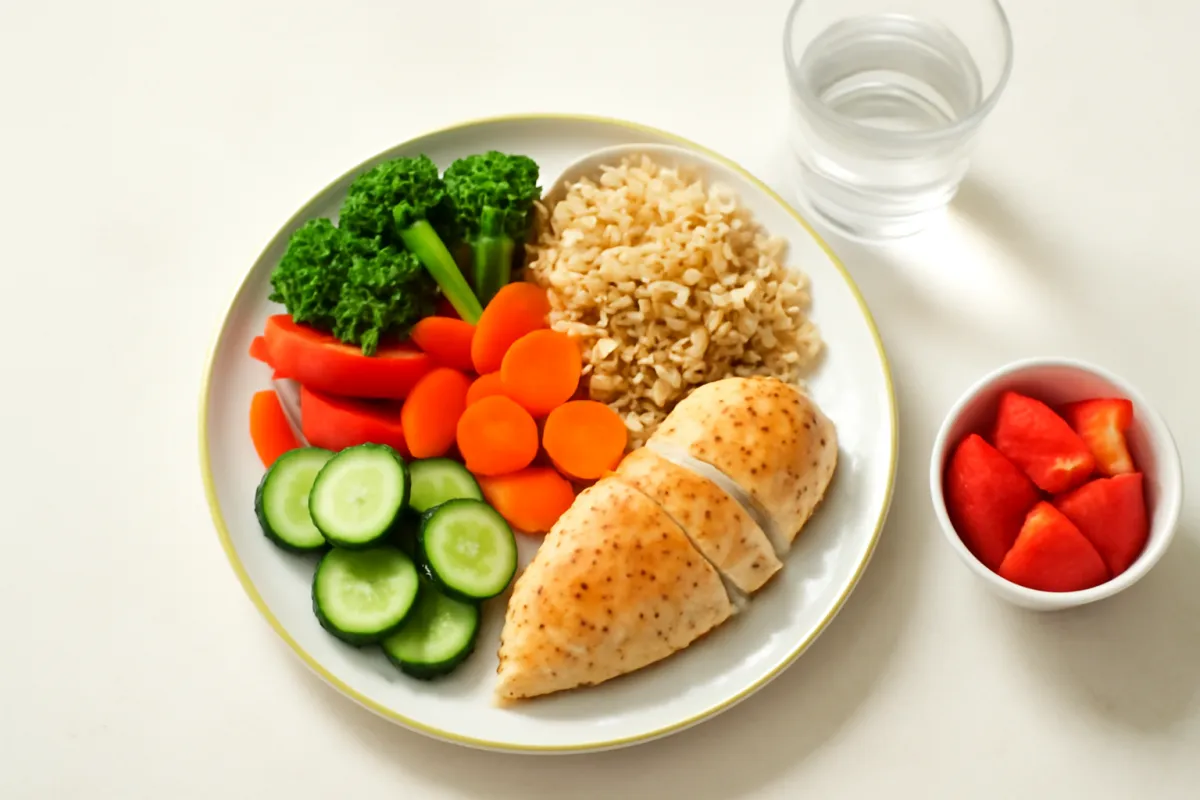
Here is one illustrative day built to land near the middle of the range: 2,000 calories, a 30 percent fat share, and therefore about 67 grams of fat, which is 603 calories from fat at 9 calories per gram.
Breakfast: two large eggs, about 10 grams, cooked in a teaspoon of olive oil, about 5 grams, with a slice of whole grain toast at about 1 gram and a piece of fruit. Breakfast subtotal, about 16 grams.
Mid-morning: one ounce of almonds, about 14 grams. Running total, about 30 grams.
Lunch: a large salad with four ounces of skinless chicken breast at about 4 grams, a vinaigrette made with two teaspoons of olive oil at about 9 grams, and a quarter of a medium avocado at about 7 grams, with bread or grains alongside. Lunch subtotal, about 20 grams. Running total, about 50 grams.
Mid-afternoon: plain yogurt with berries, about 2 grams. Running total, about 52 grams.
Dinner: four ounces of salmon at about 10 grams, roasted vegetables tossed with a teaspoon of oil at about 4 grams, and brown rice at about 1 gram. Dinner subtotal, about 15 grams. Day total, about 67 grams.
The saturated share of that day lands somewhere near 10 to 12 grams, comfortably under both the roughly 22 gram figure at 10 percent of calories and the 20 gram label Daily Value, because the fat is coming mainly from oil, nuts, avocado and fish rather than from butter, cheese and fatty meat. Run your own calorie level through the companion below to see the same day rescaled.
Spreading fat across meals
There is no strong general reason to divide fat evenly across the day, but there are two practical arguments for not concentrating it all in one meal.
The first is the absorption point already made: fat-soluble vitamins are taken up alongside fat in the same meal, so a vegetable-heavy lunch with no fat at all is leaving something on the table. The second is satiety. A completely fat-free meal tends to be less satisfying, and the gap usually reappears as an unplanned snack.
Divided evenly across three meals, a 67-gram day is roughly 22 grams per meal, and across four eating occasions it is roughly 17 grams each. In food terms, 22 grams is about a tablespoon and a half of oil, or two eggs plus a small handful of nuts, or a modest portion of oily fish. It is not much, which is a useful reality check for anyone who imagines a fat target requires effort to reach.
Most people do not need to plan this at all. Ordinary meals built around a protein, vegetables, a starch and some kind of fat, whether oil, dressing, nuts or avocado, distribute fat reasonably without any arithmetic. The counting is a diagnostic tool for a week, not a permanent habit.
How fat fits with protein and carbs
Because the three macronutrients share one 100 percent, a fat decision is always simultaneously a carbohydrate and protein decision. The commonly cited ranges are roughly 20 to 35 percent for fat, roughly 45 to 65 percent for carbohydrate, and roughly 10 to 35 percent for protein, and any combination that adds to 100 while sitting inside all three is a defensible shape.
A conventional middle sits near 30 percent fat, 50 percent carbohydrate and 20 percent protein. On 2,000 calories that is about 67 grams of fat, about 250 grams of carbohydrate at 4 calories per gram, and about 100 grams of protein at 4 calories per gram. Check the arithmetic and it closes: 603 plus 1,000 plus 400 is a little over 2,000, which is close enough given the rounding at each step.
Move one lever and the others respond. Raise protein and either fat or carbohydrate has to give. Cut carbohydrate sharply and fat rises to fill the space, as the low-carb section showed. There is no combination that avoids the trade, which is the whole reason the ranges are published as a set.
Most people are better served by setting protein first, since it has the clearest evidence for a floor, then letting fat and carbohydrate divide the remainder according to preference. Our macro calculation walkthrough runs that sequence step by step.
Conditions where fat intake is managed differently
The general population range stops applying when a medical condition enters the picture, and several conditions specifically change how fat is handled.
Gallbladder conditions are the clearest example, because bile is central to fat digestion and people who have had gallbladder surgery or who experience gallstone symptoms are commonly advised to manage fat intake in a particular way. Pancreatic conditions affect the enzymes that break fat down. Certain fat malabsorption disorders require specific types of fat rather than simply less of it. Some lipid disorders come with individualised targets that look nothing like a population range.
Cardiovascular risk management, blood sugar management and several medications also interact with dietary fat in ways that a general range cannot capture. So does pregnancy, where omega-3 intake in particular is usually discussed individually.
The consistent thread is that every one of these calls for a plan set by a qualified clinician or registered dietitian who knows your history, and the figures in this evidence review are not a substitute for that plan. If any of these apply to you, treat the numbers here as background reading for a conversation rather than as instructions to follow.
Common mistakes with daily fat
Treating a percentage as a gram number. Thirty percent of calories is not 30 grams, and the confusion is easy to make. At 2,000 calories the answer is about 67 grams, more than double.
Dividing by 4 instead of 9. The 4-calories-per-gram figure belongs to protein and carbohydrate. Using it on fat overstates the grams by more than double.
Assuming the label percentage describes your day. The percent Daily Value on a panel is built on a 2,000-calorie reference at the top of the range, so it does not describe someone eating 1,500 or 2,800 calories.
Counting the fat you add and ignoring the fat that was already there. The oil in a dressing gets remembered; the fat inside cheese, meat, pastry and fried food often does not.
Going very low on fat and expecting it to help. The 20 percent floor exists for absorption and essential fatty acid reasons, and very low fat meals tend to be less satisfying.
Reading the total and ignoring the split. Two 67-gram days made of completely different fats are not the same day, and general guidance cares more about the difference than about the total.
Treating the number as precise. Portion sizes, cooking losses and label rounding all introduce error, and the range itself is wide. A ballpark that is consistently in the right neighbourhood beats a precise figure that is wrong.
A quick daily fat checklist
Know your rough calorie level first, because every fat figure derives from it. Multiply by 0.20 and by 0.35 and divide each by 9 to get your own version of the 44-to-78-gram band.
Take a middle figure near 30 percent as an unremarkable default rather than a target, and stop treating small daily variation as meaningful.
Measure your cooking oil for three or four days to calibrate the estimate, then go back to pouring.
Build most of the total from liquid plant oils, nuts, seeds, avocado and fish, and keep the solid fats for where they genuinely matter.
Keep saturated fat under roughly a tenth of calories, about 22 grams at 2,000, and check ingredient lists for partially hydrogenated oils.
Include some fat in vegetable-heavy meals so the fat-soluble vitamins have something to travel with.
If you eat fish, aim for oily fish a couple of times a week; if you do not, keep walnuts, flaxseed or chia in regular rotation for alpha-linolenic acid.
Read the serving size before the fat line on any panel, since the serving size decides what every number below it means.
Take any of it to a doctor or registered dietitian before acting on it if you have a cardiovascular, metabolic, gallbladder, pancreatic or medication concern.
The bottom line
How much fat per day has an answer that is easy to state and easy to mistranslate. General guidance commonly puts fat at 20 to 35 percent of daily calories, and at about 9 calories per gram that is roughly 44 to 78 grams on a 2,000-calorie day, scaling to about 53 grams at the middle of a 1,600-calorie day and about 100 grams at the middle of a 3,000-calorie day. The percentage exists because fat only makes sense in proportion to everything else you eat, and the conversion to grams is the step that turns it into something you can use at a stove.
Past the total, the useful points are these. Fat at 9 calories per gram is the macronutrient most easily under-counted, and unmeasured cooking oil is usually where the gap hides. Composition draws more attention than quantity: most of it unsaturated, saturated under roughly a tenth of calories, trans fat near zero. Very low fat is not a free win, because fat-soluble vitamins need fat to be absorbed and two fatty acids are essential. And on a low-carbohydrate pattern the whole band moves, because the macronutrients share one hundred percent between them. Every figure here is a commonly cited, illustrative reference rather than a personal prescription, so pair it with our carbohydrate evidence review and our protein evidence review, and take anything specific to your health to a qualified professional.
This evidence review exists to explain commonly cited dietary reference figures for fat in plain language, and it is educational content rather than medical, nutritional or dietetic advice; reading it establishes no clinician-patient relationship. Every gram amount, percentage, ratio and food figure above is an illustrative population reference or a typical approximation, not a measurement of any particular food or a target set for any particular person, and real foods vary widely by cut, brand, ripeness and cooking method. Fat requirements and fat tolerance differ from person to person, and several conditions, among them cardiovascular and lipid disorders, diabetes, gallbladder and pancreatic disease, and fat malabsorption, call for individually managed fat intake that overrides any general figure printed here; some medications interact with dietary fat as well. Very low fat and very high fat patterns both carry trade-offs and suit some people and not others. Before changing how you eat, and for any fat target matched to your own body, medications, blood lipids or medical history, speak with a qualified health professional such as a doctor or registered dietitian.
Frequently asked questions
How much fat per day should you eat?
General dietary guidance commonly expresses fat as a share of total calories rather than a fixed gram count, with a widely cited acceptable range of roughly 20 to 35 percent of daily calories. Because fat supplies about 9 calories per gram, that range works out to roughly 44 to 78 grams on a 2,000-calorie day, and it scales up or down with how much you eat overall. A person eating 1,600 calories would land nearer 36 to 62 grams, and a person eating 3,000 calories nearer 67 to 117 grams. These are population reference figures rather than a personal prescription, and the right amount for you depends on your body, your usual eating pattern, and any medical conditions, so confirm anything specific with a doctor or registered dietitian.
How many grams of fat per day on a 2,000-calorie diet?
At 2,000 calories, the commonly cited 20 to 35 percent range converts to about 44 grams at the low end and about 78 grams at the high end, with a middle-of-the-road 30 percent landing near 67 grams. The arithmetic is simple: multiply your calories by the percentage, then divide by 9, because fat carries about 9 calories per gram. That 78-gram figure is also why United States nutrition labels use a Daily Value near 78 grams of total fat, since the label reference is built on a 2,000-calorie day at the top of the range. Treat any of these numbers as an illustrative reference point rather than a target you must hit, and discuss your own intake with a qualified professional.
Why is fat given as a percentage instead of a gram number?
Fat is one of three calorie-supplying macronutrients, so the amount that makes sense depends entirely on how many calories you eat in total. A flat gram figure that suited a 3,000-calorie day would crowd out almost everything else on a 1,500-calorie day, and the same figure would leave a very large eater short. Expressing fat as a share of calories keeps the three macronutrients in proportion with each other and lets one reference range describe a whole population. The trade-off is that a percentage means nothing at the grocery store, which is why converting it into grams, as the calculator alongside does, is the step most people skip.
How much saturated fat per day is commonly suggested?
General guidance commonly suggests keeping saturated fat below about 10 percent of daily calories, which at 2,000 calories works out to roughly 22 grams. United States nutrition labels use a slightly rounder reference Daily Value near 20 grams of saturated fat against the same 2,000-calorie reference, so the two figures sit close together without being identical. Saturated fat comes mostly from fatty cuts of meat, butter, cream, full-fat dairy, coconut and palm oils, and many baked and fried packaged foods. Both figures are population reference values rather than personal limits, and anyone with a cardiovascular or metabolic condition should have their own target set by a clinician.
Can eating too little fat cause problems?
Fat does jobs that calories alone do not capture. Vitamins A, D, E and K are fat-soluble, meaning the body absorbs them alongside dietary fat, so a persistently very low-fat pattern can make those vitamins harder to take up even when the foods containing them are on the plate. Fat also supplies the two essential fatty acids the body cannot manufacture, linoleic acid and alpha-linolenic acid, and it contributes a great deal to how satisfying a meal feels. This is general physiology rather than a diagnosis, and symptoms you are worried about belong with a clinician rather than with an article.
How much fat per day on a low-carb or ketogenic pattern?
When carbohydrate drops, the calories have to come from somewhere, and in practice most of them come from fat, so the fat share rises well above the usual 20 to 35 percent band. A moderate low-carb pattern is often described around 45 percent of calories from fat, which is roughly 100 grams on a 2,000-calorie day, while ketogenic patterns are commonly described near 70 percent, roughly 156 grams on the same 2,000 calories. Those are descriptions of what such patterns look like, not recommendations, and they sit outside the general population range on purpose. Low-carbohydrate and ketogenic eating carries trade-offs and is not appropriate for everyone, so treat it as a plan to make with a professional.
Why is fat so easy to under-count?
Fat carries about 9 calories per gram, more than double the roughly 4 calories per gram in protein and carbohydrate, so a small volume of fat represents a large number of calories. A tablespoon of oil is a barely visible film in a pan and about 14 grams of fat, roughly 126 calories, and a generous pour is easily two or three times that. Fat is also the macronutrient most often invisible: it is absorbed into the food during cooking, blended into sauces and dressings, and built into baked goods. Measuring cooking oil for a few days, rather than estimating it, is the single change that most often closes the gap between what people think they eat and what they actually eat.
Does the type of fat matter more than the amount?
For most people eating within the commonly cited range, the composition of the fat draws more attention in general dietary guidance than the total. The usual framing is to build most of the total from unsaturated sources such as olive and other liquid plant oils, nuts, seeds, avocado and fish, to keep saturated fat under roughly 10 percent of calories, and to keep industrially produced trans fat as close to zero as possible. That is a shape rather than a rule, and total intake still matters because fat is energy-dense. None of this is a treatment for any condition, and people managing cholesterol, blood sugar, gallbladder or pancreatic issues should follow a plan set with their clinician.

Hamza Hai is the editor of NourishMark. She holds an MBA and reviews the site's articles against our editorial standards, checking that every figure is labelled for what it is, that nothing is presented as verified fact without a source the reader can check, and that the writing stays useful to a non-specialist.