What's in this review
- Why calorie figures for common foods vary
- How many calories in an egg
- How many calories in a banana
- How many calories in an apple
- A quick calorie reference for common foods
- Calories in common fruits
- Calories in common vegetables
- Calories in eggs and dairy
- Calories in common proteins
- Calories in grains and starches
- Calories in common snacks
- Calories in common drinks
- Comparing calorie density across food groups
- How to read a calorie count on a label
- Portion versus serving: the difference that trips people up
- Why the same food shows different calorie numbers
- How cooking and preparation change calories
- Building a day from common foods
- Tallying the calories in a meal
- Liquid calories: the ones people miss
- Common mistakes when reading calorie numbers
- A quick calorie-reading checklist
- The bottom line
Short answer: Commonly cited figures put a medium banana near 105 calories, a medium apple near 95, and a large egg near 72, all before any cooking fat. Every figure refers to a stated serving, so match the serving to the portion you actually eat before comparing. Calorie density varies enormously, with fats and nuts dense per bite and watery fruit and vegetables light, and sources differ because of size, cooking, and rounding.
The calories in common foods are easy to look up and surprisingly easy to misread, which is why the same banana or egg can seem to carry a different number every time you check. A medium banana is commonly cited near 105 calories and a large egg near 72, yet one source lists a food raw and another cooked, one gives a small serving and another a generous portion, and an app rounds where a package does not. The energy in everyday food is not mysterious, and there are widely referenced figures for almost everything you eat. The trick, as with any measurement, is knowing which number you are looking at and why it differs from the one beside it.
This evidence review is a plain-language reference for the calories in common foods, organized so you can find a food fast and understand the figure once you do. It answers the three most-searched questions first, the calories in an egg, a banana, and an apple, then lays out commonly cited tables by food group, from fruit and vegetables to proteins, grains, snacks, and drinks. It explains how to read a calorie count, why portion and serving are not the same thing, and why the same food shows different numbers in different places. It is educational, describes food composition only, and is not diet or medical advice. For how many calories you personally need, see our calorie needs review, and you can tally a meal in the companion below.
Key takeaways
- A medium banana is commonly cited near 105 calories, a medium apple near 95, and a large egg near 72, all before any cooking fat.
- Every calorie figure refers to a stated serving, so the first move is always to match the serving to the portion you actually eat.
- Calorie density varies enormously: fats and nuts are dense per bite, while watery fruits and non-starchy vegetables are light.
- The same food shows different numbers across sources because of size, variety, cut, cooking, and rounding, which is normal, not error.
- All figures here are commonly cited, illustrative references, not exact measurements; use a food label or database for precision and a professional for personal targets.
Why calorie figures for common foods vary
Before any table, it helps to accept a fact that makes every later number easier to trust: there is no single, exact calorie count for a food, only commonly cited averages that individual items scatter around. A banana grown large and ripe carries more calories than a small green one, a marbled cut of beef more than a lean trim, a heaping cup of rice more than a level one. The figures in this review are the widely referenced middle of those ranges, useful for planning and comparison but never a precise reading of the specific food on your plate.
Three forces explain most of the variation. Size and variety move the number at the source, since calories track the amount of food fairly closely. Preparation moves it again, because added oil, water loss, and trimming all change a finished dish. And measurement itself adds a margin, as different databases sample different foods and packages round to tidy figures within an allowed tolerance. None of this makes calorie counts useless. It simply means they are a well-informed ballpark, which is exactly what a quick reference should be, and it is why a food label or a reputable database is the right tool when you genuinely need precision rather than a sensible estimate.
How many calories in an egg
Start with the food people search for most. One large egg is commonly cited at roughly 72 calories, with the usual range running from about 70 to 80 depending on size, before you add any fat to the pan. A small egg sits nearer 55 and a jumbo one closer to 90, so egg size is the main thing that moves the figure. Most of those calories live in the yolk, which also carries the egg’s fat and much of its nutrition, so eating the whole egg gives the full number rather than the leaner white alone.
Cooking is where egg calories quietly climb. The 72-calorie figure is for the egg itself, so poaching or boiling keeps it close to that, while frying or scrambling in a tablespoon of oil or butter can add 40 to 100 calories per egg on top. A two-egg breakfast is therefore anywhere from about 145 calories plain to well over 250 once cooked in fat, which is a useful reminder that preparation often matters as much as the food. For the protein side of the same question, our protein reference for common foods puts an egg near 6 grams. Treat 72 as an illustrative reference and reach for a label or database when you need a tighter number.
How many calories in a banana
The second most-searched fruit has an equally clean reference: a medium banana, roughly seven to eight inches long, is commonly cited at about 105 calories. A smaller banana lands nearer 90 and a large one closer to 120, because the calories follow the size of the fruit fairly closely, which is true of most whole fruits. Almost all of those calories come from natural carbohydrate, arriving alongside fiber, potassium, and other nutrients that a bare calorie figure never shows.
That last point is worth holding onto as the tables unfold. Two foods with the same calorie count can be very different nutritionally, and a banana’s 105 calories carry fiber and micronutrients that an equally caloric handful of candy does not. The banana is also a good illustration of why ripeness matters a little: a very ripe banana tastes sweeter as starch converts to sugar, though the total calories barely move, since converting one carbohydrate to another does not change the energy much. As always, 105 is a widely referenced average, not a precise measurement of the banana in your hand, and it is the kind of figure a database will refine if you weigh the fruit.
How many calories in an apple
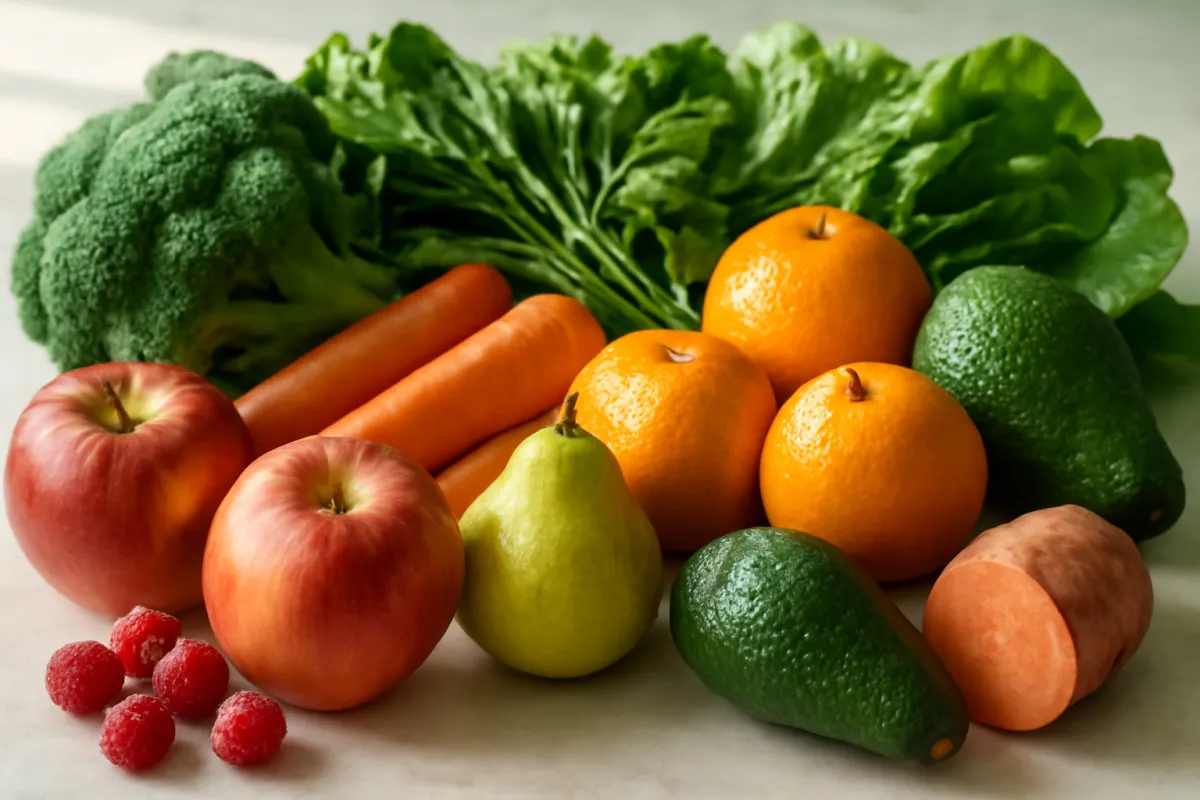
Rounding out the top three, a medium apple eaten whole with the skin is commonly cited at roughly 95 calories. A small apple falls nearer 55 to 80 and a large one can reach 115 or more, so once again the size of the fruit is what moves the figure most. The calories are almost entirely natural carbohydrate, and the apple’s high water content and skin-borne fiber are part of why it feels filling for such modest energy, a quality that makes fruit a frequent star of any low-calorie snack list.
The apple also makes a quiet point about form. A whole apple at 95 calories behaves very differently from the same apple pressed into juice, where the fiber is stripped and a cup can carry more calories than the fruit while filling you less. This is the difference between eating and drinking your calories, a theme the drinks section returns to. Variety matters a little too, since a dense, sweet variety runs slightly higher than a light, tart one, but the differences are small next to size. Read 95 as an illustrative reference, and remember that a food label or database gives a tighter number when a recipe or a goal calls for one.
A quick calorie reference for common foods
Here is the reference the rest of this review builds on: commonly cited calories for staple foods at a normal serving, grouped so you can scan to what you need. The serving column is the amount the calorie figure describes, and it is the first thing to check, since a figure only means something once you know the portion it refers to. Every number is a widely referenced average that varies with size, variety, and preparation.
| Food | Common serving | Illustrative calories |
|---|---|---|
| Banana | 1 medium | ~105 |
| Apple | 1 medium | ~95 |
| Orange | 1 medium | ~62 |
| Strawberries | 1 cup | ~49 |
| Egg | 1 large | ~72 |
| Chicken breast, cooked | 100 g | ~165 |
| Salmon, cooked | 100 g | ~208 |
| Lean ground beef, cooked | 100 g | ~250 |
| Canned tuna, drained | 100 g | ~130 |
| Tofu, firm | 100 g | ~145 |
| Black beans, cooked | 1 cup | ~227 |
| Almonds | 1 oz (~28 g) | ~164 |
| Bread | 1 slice | ~80 |
| White rice, cooked | 1 cup | ~205 |
| Pasta, cooked | 1 cup | ~220 |
| Oats, dry | 1/2 cup | ~150 |
| Potato, baked | 1 medium | ~160 |
| Cheddar cheese | 1 oz (~28 g) | ~115 |
| Whole milk | 1 cup | ~150 |
| Greek yogurt, plain | 3/4 cup | ~130 |
| Potato chips | 1 oz (~28 g) | ~150 |
| Dark chocolate | 1 oz (~28 g) | ~170 |
| Orange juice | 1 cup | ~110 |
| Soda | 12 oz can | ~140 |
The table rewards a slow read. Notice how a whole banana and a glass of orange juice sit close together in calories while the fruit brings fiber the juice has lost. Notice how a small ounce of almonds or chocolate matches a slice of bread, because dense, fatty foods pack more energy into less weight. And notice how the proteins cluster in a middle band that fat content, not the meat itself, mostly explains. Read the serving beside every figure, and treat the whole table as an illustrative map rather than a precise ledger.
Calories in common fruits
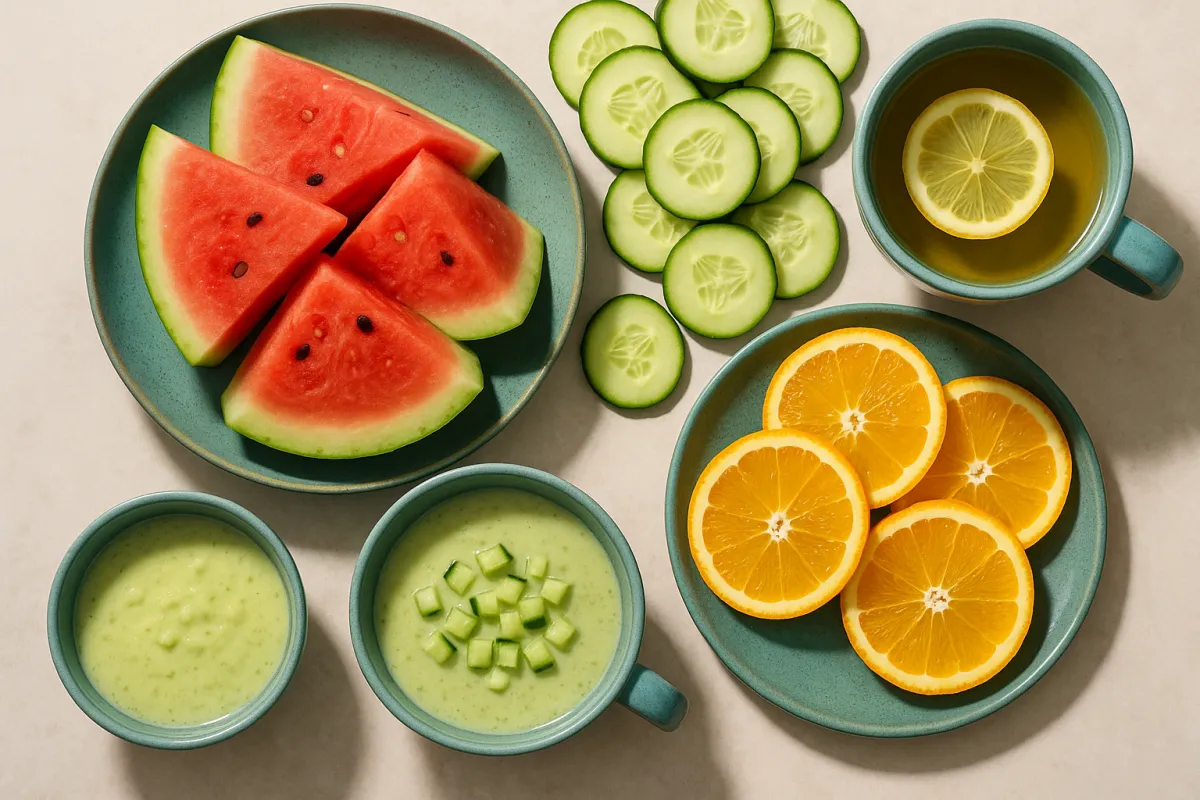
Fruit is the food group where a light reputation is mostly earned, since most whole fruits are high in water and fiber and modest in calories. Berries sit at the low end, with a cup of strawberries near 49 calories and a cup of blueberries near 85, while denser fruits like bananas and grapes run higher, a cup of grapes landing near 104. Stone fruits and citrus fall in between, an orange near 62 and a medium peach near 60. The pattern is that watery, fibrous fruits are light for their volume, which is why a large bowl of them can still be a modest number.
| Fruit | Common serving | Illustrative calories |
|---|---|---|
| Strawberries | 1 cup | ~49 |
| Watermelon | 1 cup, diced | ~46 |
| Orange | 1 medium | ~62 |
| Peach | 1 medium | ~60 |
| Blueberries | 1 cup | ~85 |
| Apple | 1 medium | ~95 |
| Grapes | 1 cup | ~104 |
| Banana | 1 medium | ~105 |
| Avocado | 1/2 fruit | ~120 |
The outlier worth naming is avocado, which behaves less like a fruit and more like a fat: half of one carries about 120 calories because it is rich in oil rather than water. That is not a strike against it, since those are largely unsaturated fats with their own nutritional appeal, but it explains why avocado sits well above berries on any fruit list. Dried fruit is the other quiet surprise, since removing the water concentrates the calories, so a small handful of raisins can match a whole bunch of grapes. These are commonly cited figures that shift with size and ripeness, and a database refines them when you weigh the fruit.
Calories in common vegetables
Non-starchy vegetables are the lightest foods most people eat, which is why they anchor so much practical calorie advice. A cup of raw spinach carries roughly 7 calories, a medium carrot about 25, a cup of cooked broccoli near 55, and a large tomato around 22. The energy is low because these foods are mostly water and fiber with little fat or concentrated carbohydrate, so filling a plate with them adds volume and nutrients without many calories. This is the mechanism behind the common suggestion to make vegetables a large share of a meal.
| Vegetable | Common serving | Illustrative calories |
|---|---|---|
| Spinach, raw | 1 cup | ~7 |
| Tomato | 1 medium | ~22 |
| Carrot | 1 medium | ~25 |
| Broccoli, cooked | 1 cup | ~55 |
| Corn | 1 ear | ~90 |
| Sweet potato, baked | 1 medium | ~112 |
| Potato, baked | 1 medium | ~160 |
The starchy vegetables are the exception that proves the rule. Corn, peas, potatoes, and sweet potatoes carry more calories because they store energy as starch, so a baked potato near 160 calories sits closer to a grain than to broccoli. That does not make them worse, only denser, and it is worth counting them more like the grains section than the leafy greens. The other thing that moves vegetable calories is what goes on them, since a tablespoon of oil, butter, or dressing can add more calories than the vegetable itself. The vegetable figures here are illustrative references, and the toppings are where a calorie count often quietly grows.
Calories in eggs and dairy
Eggs and dairy form a middle-density group where fat content drives most of the spread. A large egg is near 72 calories, a cup of whole milk about 150, a cup of skim milk closer to 85, and an ounce of cheddar around 115. The gap between whole and skim milk is entirely the fat, which is the single biggest lever across this whole group: reduced-fat versions of the same food carry meaningfully fewer calories because fat is the most energy-dense component by weight.
| Food | Common serving | Illustrative calories |
|---|---|---|
| Skim milk | 1 cup | ~85 |
| Whole milk | 1 cup | ~150 |
| Greek yogurt, plain | 3/4 cup | ~130 |
| Cottage cheese | 1/2 cup | ~110 |
| Cheddar cheese | 1 oz (~28 g) | ~115 |
| Butter | 1 tbsp | ~100 |
| Large egg | 1 | ~72 |
Two practical notes travel with this group. First, flavored and sweetened dairy can carry far more than the plain versions, since a fruit-on-the-bottom yogurt or a chocolate milk adds sugar calories on top of the dairy, so plain plus your own fruit is usually the lighter route. Second, cheese and butter are calorie-dense enough that portion size matters more than usual, since an ounce of cheese is a small piece and a tablespoon of butter disappears into a pan. As with every group, these are commonly cited figures, and the fat and sugar content of the specific product is what a label will pin down.
Calories in common proteins
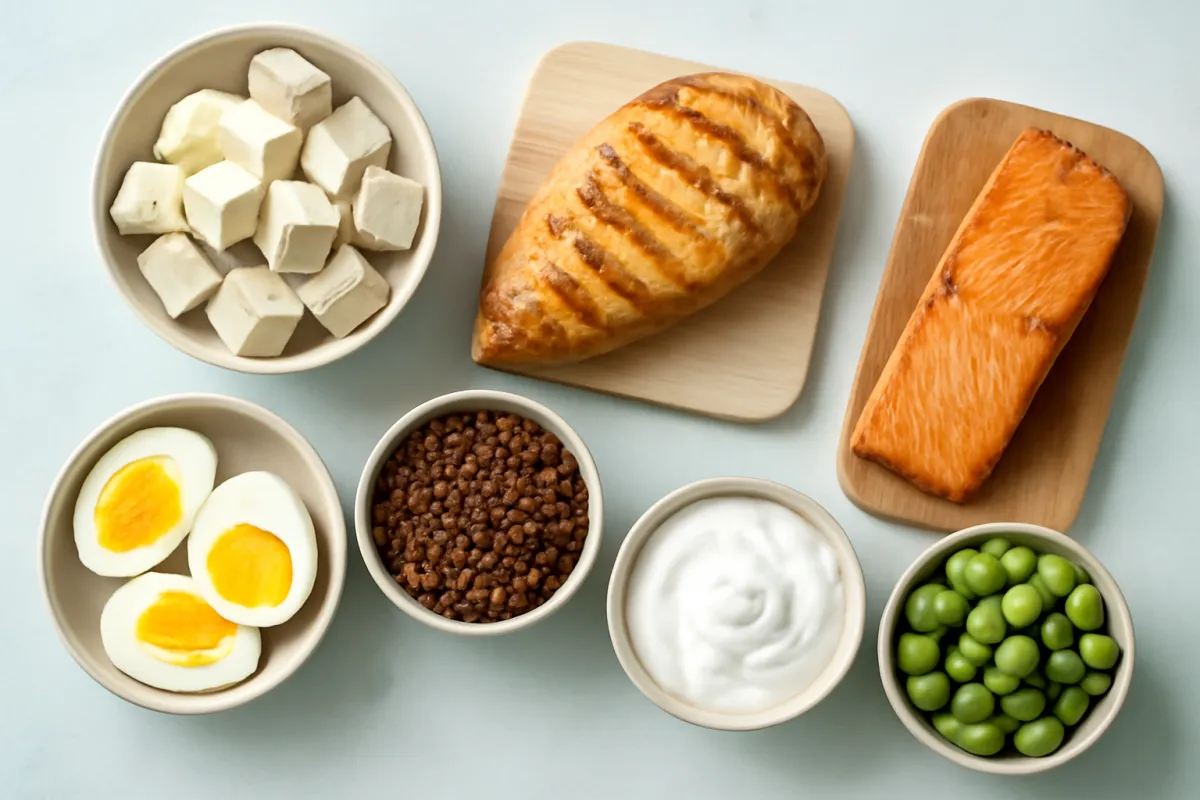
Protein foods span a wide calorie range, and the surprise for many people is that the range is driven far more by fat than by the protein itself. Lean options cluster low: 100 grams of cooked chicken breast near 165 calories, canned tuna near 130, white fish lower still. Fattier options climb steeply, with 100 grams of cooked lean ground beef near 250, salmon near 208, and fried or heavily marbled cuts higher again. Plant proteins occupy their own band, a cup of black beans near 227 and 100 grams of firm tofu near 145, with fiber and carbohydrate along for the ride.
| Protein food | Common serving | Illustrative calories |
|---|---|---|
| Chicken breast, cooked | 100 g | ~165 |
| Canned tuna, drained | 100 g | ~130 |
| Salmon, cooked | 100 g | ~208 |
| Lean ground beef, cooked | 100 g | ~250 |
| Tofu, firm | 100 g | ~145 |
| Lentils, cooked | 1 cup | ~230 |
| Black beans, cooked | 1 cup | ~227 |
| Almonds | 1 oz (~28 g) | ~164 |
| Peanut butter | 2 tbsp | ~190 |
Nuts and nut butters deserve a flag here, since they are protein foods that behave like fats on a calorie basis. An ounce of almonds near 164 calories and two tablespoons of peanut butter near 190 are genuinely nutritious, but their small serving sizes hide real energy, which is why a casual handful can add up fast. Beans and lentils, by contrast, deliver their calories with fiber and a large, filling portion. For how these foods stack up on protein rather than calories, our protein reference for common foods runs the parallel table. All figures here are illustrative and shift with cut, trim, and cooking.
Calories in grains and starches
Grains and starchy staples are the quiet backbone of most days’ calories, and their figures are worth knowing precisely because portions creep so easily. A slice of bread is near 80 calories, a cup of cooked white rice near 205, a cup of cooked pasta near 220, and half a cup of dry oats near 150. The catch is that a restaurant plate of pasta is often two or three cups, and a bagel can equal three or four slices of bread, so the per-serving figure understates what a real portion delivers.
| Grain or starch | Common serving | Illustrative calories |
|---|---|---|
| Bread | 1 slice | ~80 |
| Oats, dry | 1/2 cup | ~150 |
| White rice, cooked | 1 cup | ~205 |
| Brown rice, cooked | 1 cup | ~215 |
| Pasta, cooked | 1 cup | ~220 |
| Bagel | 1 medium | ~270 |
| Tortilla, flour | 1 medium | ~140 |
Whole-grain versions carry roughly the same calories as their refined cousins, which surprises people who expect brown rice to be lighter than white. The difference is nutritional rather than caloric, since whole grains bring more fiber and micronutrients at a similar energy cost, and the extra fiber can make them more filling per calorie. The real calorie story with grains is portion size, followed closely by what you add, since butter, oil, and sauces often carry more calories than the grain. These are commonly cited references, and measuring cooked grains once or twice is a fast way to calibrate how a real serving compares to a cup.
Calories in common snacks
Snacks are where calorie density does its most surprising work, because many are engineered to be light in the hand and heavy in energy. An ounce of potato chips is near 150 calories, an ounce of dark chocolate near 170, a chocolate chip cookie near 50, and a typical granola bar between 100 and 150. The trap is portion: an ounce of chips is a small handful, not the bag, so a casual snack often carries two or three times the labeled figure without feeling like it.
| Snack | Common serving | Illustrative calories |
|---|---|---|
| Air-popped popcorn | 1 cup | ~31 |
| Chocolate chip cookie | 1 small | ~50 |
| Pretzels | 1 oz (~28 g) | ~110 |
| Granola bar | 1 bar | ~130 |
| Potato chips | 1 oz (~28 g) | ~150 |
| Trail mix | 1 oz (~28 g) | ~160 |
| Dark chocolate | 1 oz (~28 g) | ~170 |
The contrast at the top of the table tells the story. Air-popped popcorn at about 31 calories a cup is one of the lightest snacks going, a large volume for very little energy, while dense snacks pack a small serving with the calories of a small meal. This is the same calorie-density lesson from the vegetable and nut sections, applied to the snack drawer, and it is the engine behind most low-calorie snack ideas: favor foods with air, water, or fiber that fill the plate for fewer calories. Every snack figure here is illustrative, and the package serving size is the number to check first.
Calories in common drinks
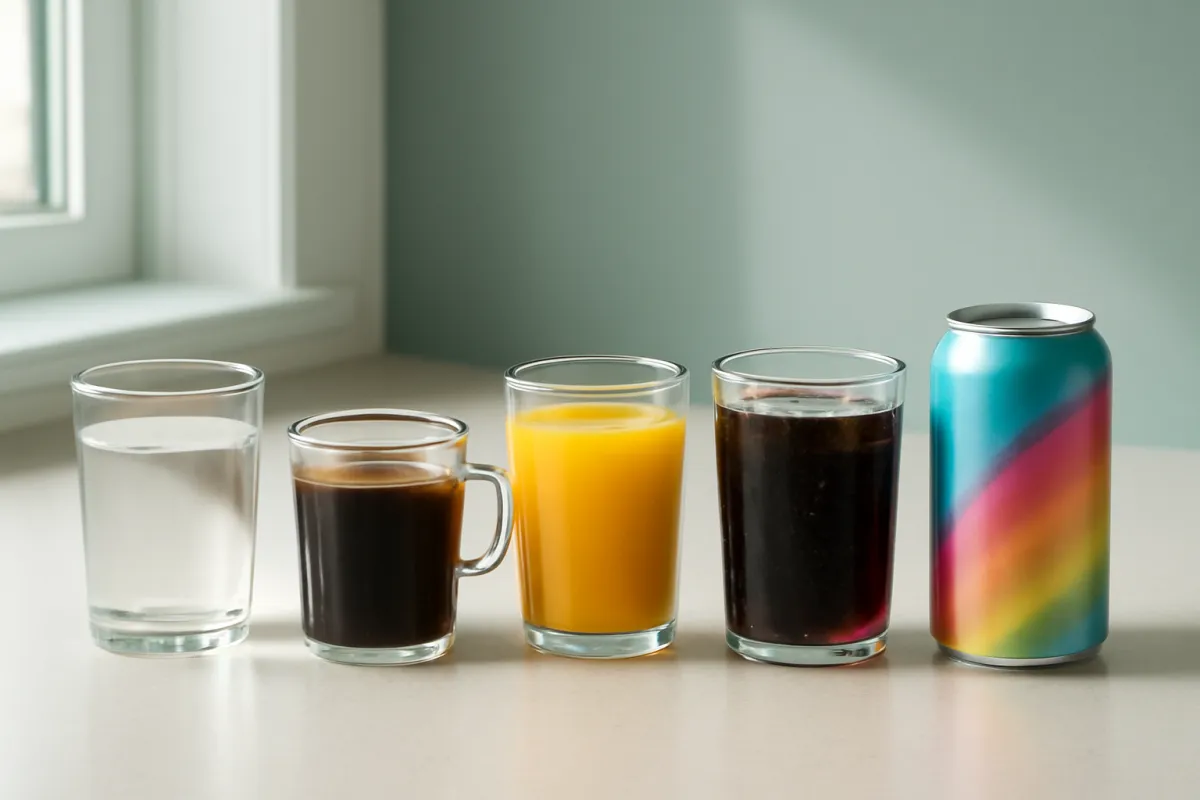
Drinks are the calories people most often overlook, because liquid energy tends not to register as eating and does little to blunt appetite. Water and black coffee are effectively zero, plain tea nearly so, but a cup of orange juice is near 110 calories, a can of soda near 140, a 12-ounce beer near 150, and a five-ounce glass of wine near 125. A large flavored coffee drink can quietly exceed a small meal. Because these arrive without the fullness of solid food, they add to a day’s total with little to show for it.
| Drink | Common serving | Illustrative calories |
|---|---|---|
| Water | any | ~0 |
| Black coffee | 1 cup | ~5 |
| Unsweetened tea | 1 cup | ~2 |
| Skim milk | 1 cup | ~85 |
| Orange juice | 1 cup | ~110 |
| Latte, whole milk | 12 oz | ~180 |
| Wine | 5 oz | ~125 |
| Soda | 12 oz can | ~140 |
| Beer | 12 oz | ~150 |
The practical takeaway is not that any drink is forbidden, since this review prescribes nothing, but that drinks are the easiest place for calories to hide and the easiest place to trim if you choose to. Swapping one sweetened drink for water or an unsweetened option removes 100 or more calories with essentially no change to how full you feel, which is why drinks are such a common focus. Sweetened coffee drinks are the modern surprise, since the milk and syrup can carry the calories the coffee never did. These are commonly cited figures, and the exact number lives on the cup or the carton.
Comparing calorie density across food groups
The single idea that ties this whole reference together is calorie density: how many calories a food packs into a given weight, which is really how many calories arrive per bite. Foods low in density, high in water and fiber, let you eat a large, satisfying volume for modest energy, while dense foods deliver a lot of calories in a small package. Lined up per 100 grams, the spread across common foods is dramatic, and seeing it explains why portion feel and calorie count so often disagree.
Illustrative calories per 100 grams
Commonly cited energy density for representative foods, cooked where relevant. Reference figures, not exact measurements.
Bars scale to almonds at 100 percent. Density is only one view: a normal serving of broccoli is large and of almonds small, so per-serving calories differ from this per-100-gram picture.
The chart makes the earlier surprises concrete. Almonds and cheese sit near the top because they are rich in fat, the most energy-dense component, while broccoli sits near the bottom because it is mostly water. Chicken, rice, and banana fill the middle, which is why they anchor so many ordinary meals. Density is not a verdict on any food, since dense foods carry nutrients and satisfaction a spreadsheet misses, but it is the reason a small snack can out-calorie a large salad. Use density to understand a food and serving size to build a plate, and keep in mind that these are illustrative reference figures.
How to read a calorie count on a label
The Nutrition Facts panel is the most reliable calorie figure you will find, because it is stated for a specific serving right on the package, and reading it well comes down to two lines. The serving size sits at the top, and every other number, calories included, refers to that exact amount. So the first move is never to read the calories, it is to check the serving size and compare it to how much you actually plan to eat, since packages often list a serving smaller than a real portion.
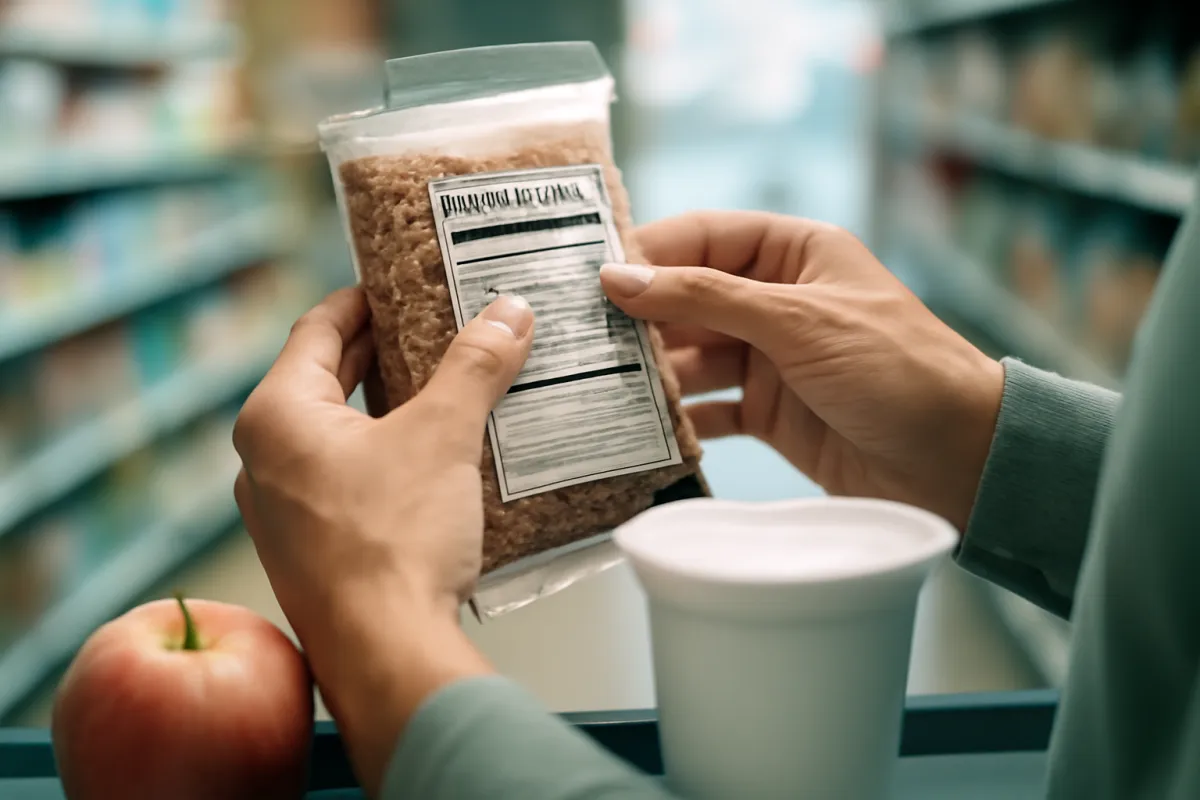
From there the arithmetic is simple. If a container lists two servings and you eat the whole thing, double the calories, and every other number too. It helps to remember that the panel describes the food as sold, so a cereal listed dry will gain calories once you add milk, and a mix listed as prepared already includes what the recipe adds. For loose whole foods that carry no label, such as a banana, an egg, or a chicken breast, the reference tables above stand in for the panel. Our note on how to read a nutrition label walks through the full panel, and reading a few labels for a week is the fastest way to calibrate your eye. Use the label or a database whenever you need a figure tighter than the illustrative ones here.
Portion versus serving: the difference that trips people up
The gap between a portion and a serving is responsible for more calorie confusion than any table, so it is worth stating plainly. A serving is a standardized amount, defined on a label or in a database, while a portion is simply how much you put on your plate, and the two are frequently very different. A cereal box may call three quarters of a cup a serving while a real bowl holds two, a bag of chips may list a serving as a small handful while a person eats half the bag, and a bottled drink may count as two servings despite being finished in one sitting.
This matters because every calorie figure, in this review or anywhere, is attached to a specific serving. The number is only correct for that amount, so reading it without checking the serving is how a modest figure becomes a large intake in practice. The reliable habit is a two-step read: find the serving the figure describes, then scale it to your real portion before trusting the total. Measuring a few of your regular foods once, a cup of rice, a bowl of cereal, a pour of oil, quickly teaches you how your usual portions compare to the standard servings, after which eyeballing becomes reliable. This is a reading skill more than an eating rule, and it makes every figure in this reference more useful. You can practice the arithmetic on a full meal in the companion below.
Why the same food shows different calorie numbers
It unsettles people to look up one food and find three different calorie counts, so it helps to know that this is normal and mostly honest. Different databases measure different physical samples of a food, and real foods vary by size, variety, ripeness, cut, and fat content, so two reputable sources can list slightly different numbers for the same item without either being wrong. A larger banana genuinely carries more calories than a small one, and a database reporting the average of many bananas will differ from a label describing one particular fruit.
Preparation widens the gap further. A food listed raw differs from the same food cooked, because water loss, added fat, and trimming all change the finished dish, and a source may not say which state it means. On top of that, packages round to tidy figures within a tolerance the labeling system allows, so a bar listed at 200 calories might truly be 185 or 215. The lesson is not to distrust the numbers but to hold them loosely: they are commonly cited averages with a real margin, precise enough to compare foods and plan a day, not precise enough to treat as exact. When a decision genuinely turns on the figure, a food label or a trusted database is the tool, and a health goal belongs with a professional rather than a table.
How cooking and preparation change calories
Cooking rarely changes the calories in the underlying ingredient, but it very often changes the calories in the finished dish, and telling those two apart clears up a lot of confusion. Boiling, grilling, or baking a food without added fat leaves its calories close to the raw figure, adjusted only for water lost or gained, which is why a plain baked potato stays near its listed number. The change happens when preparation adds something, and the most common addition is fat.
A tablespoon of oil carries about 120 calories, a tablespoon of butter about 100, and these disappear invisibly into a pan, a dressing, or a sauce. A modest chicken breast near 165 calories can become a 300-calorie plate once fried and sauced, and a light salad can outpace a burger once the dressing goes on. Breaded and deep-fried foods climb the most, since they absorb oil as they cook. The practical takeaway is to count the extras, not just the food, because added fats and sugars are where a sensible-looking meal quietly gains its calories. Water-based cooking adds nothing, which is why steaming, poaching, and grilling keep dishes close to their base figures. These are illustrative amounts, and the exact addition is whatever you actually pour, spread, or fry with.
Building a day from common foods
To see how these figures assemble, here is how ordinary foods add up across an illustrative day near 2,000 calories, a common reference point that is not a recommendation for any individual. The value of the exercise is not the total but the shape: seeing where a day’s calories concentrate, and how ordinary meals stack up, is what turns a table of numbers into something you can picture on a plate.
An illustrative 2,000-calorie day from common foods
Reference meals summing to about 2,000 calories. Approximate figures, not a personal target.
Segments show each meal's share of an illustrative 2,000-calorie day. Swap foods within a group and the shape holds; these are reference figures, not a prescribed intake.
The example makes two things visible. First, a day’s calories assemble from unremarkable meals, no single food carrying an outsized share, once each meal is built from the tables above. Second, the foods are interchangeable within their groups: swap the chicken for tofu, the rice for pasta, the salmon for lean beef, and the day lands near the same place, because foods within a group cluster in calories. The added fats and drinks not shown here are exactly where a real day tends to drift higher, which is the practical reason to count them. For how a personal target is estimated, our calorie needs review walks through the math, and 2,000 here is illustrative arithmetic, not advice.
Tallying the calories in a meal
Adding up a meal is the everyday version of everything above, and it is a habit worth practicing because a plate is where the tables meet reality. The method is simple: identify each component, match it to a serving, scale to your real portion, and sum, remembering to count the drink and the cooking fat that are so easy to skip. A breakfast of two eggs, two slices of toast, a pat of butter, and a banana runs roughly 145 plus 160 plus 100 plus 105, near 510 calories, and the butter alone is a fifth of that.
Doing this a few times builds an intuition that soon makes formal tallying unnecessary. You start to see that the drink, the dressing, and the second helping are usually where the surprises live, and that the main food is often the most predictable part of the plate. It also reveals how interchangeable the components are, since swapping within a group barely moves the total. The point is not to weigh every meal forever, which few people want and nobody needs, but to calibrate your eye so a glance gives a reliable ballpark. Try it on your own plate in the companion below, which tallies a meal from common foods and shows its share of an illustrative day. Every figure it uses is a commonly cited reference, not an exact measurement.
Liquid calories: the ones people miss
If there is one place a calorie tally goes wrong, it is drinks, so they earn their own reminder. Liquid calories slip past the count for two reasons: pouring rarely feels like eating, and the body does little to reduce later meals to compensate for them, so a sweetened drink tends to add to a day rather than replace part of it. A day that looks moderate on the plate can carry several hundred uncounted calories in juice, soda, sweetened coffee, or alcohol.
This is not an argument against any drink, since this review recommends nothing and plenty of people enjoy these without issue. It is simply the observation that drinks are the easiest calories to overlook and, for anyone who chooses to trim, the easiest to remove without feeling deprived, because swapping a sweetened drink for water or an unsweetened option subtracts calories with almost no change to fullness. Sweetened coffee drinks are the modern blind spot, since milk and syrup can turn a near-zero coffee into a small meal. When you tally a meal, count the glass along with the plate, and let the drink figures in the table above stand in until the label or menu gives an exact number.
Common mistakes when reading calorie numbers
A handful of recurring errors explain most calorie confusion, and each is easy to avoid once named.
- Ignoring the serving size. The calorie figure refers to the stated serving, which is often smaller than a real portion, so a number can look modest and eat large.
- Forgetting the extras. Oil, butter, dressing, and sauce carry real calories that the base food’s figure does not include, and they are where meals quietly grow.
- Overlooking drinks. Juice, soda, sweetened coffee, and alcohol add calories that do not blunt appetite and rarely get counted.
- Confusing density with amount. A food dense per bite can carry little per small serving, and a light food eaten in large volume can carry a lot, so read weight and portion together.
- Treating estimates as exact. Every figure here and in most apps is a commonly cited average with a real margin, not a precise measurement.
- Judging a food by fullness alone. Feeling full is not the same as eating few calories, since dense foods can be small and light foods large.
Each of these is a reading error more than an eating one, and clearing them up makes every table above far more useful. The numbers are only as good as your grasp of which number you are looking at.
A quick calorie-reading checklist
Turn the review into a habit with a short routine you can run at any meal.
- Check the serving size first, on a label or in the table, before trusting any calorie figure.
- Scale to your real portion, doubling or halving the number to match what you actually eat.
- Count the extras, adding the oil, butter, dressing, and sauce that the base figure leaves out.
- Include the drink, since liquid calories are the ones most often missed.
- Compare within a group when swapping foods, knowing that items in the same group cluster in calories.
- Treat every number as a ballpark, reaching for a label or database when a recipe or goal needs precision.
Run your own plate through the companion below to see how an ordinary meal adds up, and confirm anything tied to a health goal with a qualified professional.
The bottom line
The calories in common foods are not a mystery once you know which number you are reading. A medium banana sits near 105, a medium apple near 95, and a large egg near 72, while proteins cluster in a fat-driven middle band, grains ride on portion size, vegetables stay light, and drinks hide the calories people most often miss. Read the serving beside every figure, scale it to your real portion, count the oil and the glass along with the plate, and use calorie density to understand why a small snack can out-calorie a large salad. Do that, and a day’s calories become legible rather than intimidating, assembled from ordinary groceries you can now read at a glance. Every figure here is a commonly cited, illustrative reference for food composition, not an exact measurement or a personal target, so pair it with our calorie needs review for how much you need, reach for a food label or database when you need precision, and confirm anything specific to your health with a qualified professional.
This evidence review is published for education and describes the commonly cited calorie content of foods, not medical, dietetic, or dietary advice, and reading it creates no clinician-patient relationship. Every calorie figure and serving size above is an illustrative, widely referenced average rather than an exact measurement or a personal recommendation, and real foods vary by size, variety, ripeness, cut, fat content, and preparation. For any number that a recipe or goal genuinely depends on, use a current food label or a reputable nutrition database, which will be more precise than a quick reference. This article does not tell anyone how much to eat, endorse any product, or make claims about weight or health conditions; for a calorie target suited to your body, goals, medications, pregnancy, or any medical condition, consult a qualified health professional such as a doctor or registered dietitian.
Frequently asked questions
How many calories are in an egg?
One large egg is commonly cited at roughly 70 to 80 calories, with about 72 a widely used reference figure before any cooking fat is added. Most of those calories sit in the yolk, which also carries the egg's fat and much of its nutrition, so eating the whole egg gives the full figure rather than the white alone. The number shifts a little with egg size, from small nearer 55 to jumbo closer to 90, and frying or scrambling in oil or butter can add 40 to 100 calories per egg on top. Treat 72 as an illustrative reference for planning, not an exact reading of any particular egg, and use a food label or database when precision matters.
How many calories are in a banana?
A medium banana is commonly cited at about 105 calories, which is the figure most food databases use for a fruit around seven to eight inches long. A smaller banana lands nearer 90 and a large one closer to 120, because the calories track the size of the fruit fairly closely. Almost all of those calories come from natural carbohydrate, alongside fiber, potassium, and other nutrients that a bare calorie count does not show. As with every number here, 105 is an illustrative, widely referenced average rather than a precise measurement of the banana in your hand.
How many calories are in an apple?
A medium apple is commonly cited at roughly 95 calories, eaten whole with the skin, which is where much of the fiber sits. A small apple is nearer 55 to 80 and a large one can reach 115 or more, so the size of the fruit is the main thing that moves the number. The calories are almost all natural carbohydrate, and the apple's water and fiber are part of why it feels filling for its modest energy. Read 95 as an illustrative reference figure, since real apples vary by variety, ripeness, and size, and a database or label gives a tighter number when you need one.
Why do calorie counts for the same food differ between sources?
Different databases measure different samples, and foods genuinely vary by size, variety, ripeness, cut, fat content, and how they were grown or raised, so two honest sources can list slightly different numbers for the same food. Cooking adds another layer, since water loss, added oil, and trimming all change the calories in a finished dish versus the raw ingredient. Rounding rules on packages and the tolerance the labeling system allows widen the gap further. This is why every figure in this review is framed as commonly cited and illustrative, and why a food label or a reputable database is the right tool when you need precision rather than a ballpark.
What is the difference between a portion and a serving?
A serving is a standardized amount defined on a label or in a database, while a portion is simply how much you actually put on your plate, and the two are often quite different. A cereal box may list a serving as three quarters of a cup while a real bowl holds two servings, which quietly doubles the calories you take in. This matters because every calorie figure, on a package or in a table, refers to a specific serving size printed right beside it. The reliable habit is to check the stated serving first, then scale the calories up or down to match your real portion before trusting the number.
How do I read the calorie count on a nutrition label?
Start at the top of the Nutrition Facts panel with the serving size, because every other number on the label, calories included, refers to that exact amount. Then read the calories line, and if the package holds more than one serving, multiply by how many servings you actually eat. It helps to know that the panel describes the food as sold, so a cereal listed dry will gain calories once you add milk. For loose whole foods without a label, such as a banana or a chicken breast, the reference tables in this review stand in for the panel, and our note on how to read a nutrition label walks through the full process.
Which common foods are highest and lowest in calories?
Per equal weight, fats and oils sit at the top, near 900 calories per 100 grams, followed by nuts, seeds, and hard cheeses, while non-starchy vegetables and watery fruits sit at the bottom, often under 40 calories per 100 grams. Between those extremes fall proteins, grains, and starchy vegetables in a broad middle band. The practical lesson is that calorie density, meaning calories per bite, varies enormously, so a large plate of vegetables and a small handful of nuts can carry similar calories. These are illustrative reference ranges, and a food label or database gives the specific figure for any single food.
Are the calorie numbers in charts and apps exact?
No, they are useful estimates rather than exact measurements, and treating them as precise is a common mistake. The figures come from averaged samples, your particular food differs from the average, and the body does not absorb every listed calorie identically, so both sides of the ledger carry a margin. That does not make the numbers useless, since they are reliable enough to compare foods and to spot where a day's calories concentrate. Use them as a well-informed ballpark, lean on the food label or a trusted database for tighter figures, and confirm anything tied to a health goal with a qualified professional.

Hamza Hai is the editor of NourishMark. She holds an MBA and reviews the site's articles against our editorial standards, checking that every figure is labelled for what it is, that nothing is presented as verified fact without a source the reader can check, and that the writing stays useful to a non-specialist.

Dr. Shayaan Khan is the medical reviewer for NourishMark. He holds an MBBS from MGM Medical College, Navi Mumbai, and is the author of published research including a narrative review of postpartum anxiety and depression in Mental Health Science. He has taught physiology at university level. He reviews the site's health content for medical accuracy: that physiology and mechanisms are described correctly, that no claim is stated more strongly than the evidence behind it, and that anything specific to an individual reader is sent to that reader's own clinician.
Not medical advice. Dr. Khan reviews NourishMark's health content for medical accuracy. He is not a registered dietitian, he does not hold a United States practising licence, and he is not your doctor. His review does not make anything here medical advice. Always talk to a qualified health professional about your own situation, and never delay or stop care because of something you read here.