What's in this review
- Why the protein content of food matters
- Protein in 2 eggs, for reference
- How much protein is in 100g of chicken
- A commonly cited protein table for everyday foods
- A protein food chart by category
- Ranking the staples by density
- Animal protein: density and completeness
- Plant protein: variety over any single food
- High protein foods for weight loss: protein per calorie
- Complete versus incomplete proteins, and combining
- How cooking changes the numbers
- Reading a nutrition label for protein
- Budget protein: the most protein per dollar
- The high-protein label on the front of the box
- Seeing portions without a scale
- A vegetarian and vegan protein reference
- Does timing matter for these foods?
- Building a day to a protein target
- Whole food versus protein powder
- High protein breakfast foods
- High protein foods for building muscle
- Common mistakes when reading protein numbers
- A quick food-protein reference checklist
- The bottom line
Short answer: Two large eggs carry roughly 12 grams of protein, and 100 grams of cooked chicken breast is commonly cited near 31 grams. Animal foods such as chicken, fish, eggs, and yogurt tend to be dense and complete, while beans, lentils, tofu, and soy are the strongest everyday plant sources. Compare foods per 100 grams for density and per serving for real portions; cooked figures run higher than raw because water cooks off.
Ask how much protein is in two eggs or in a hundred grams of chicken and you would expect a simple answer, yet the numbers get muddled the moment you go looking. One source lists a food raw, another cooked; one gives a per-serving figure, another the per-100-gram density; a marketing label shouts one thing while the panel on the back says another. The protein content of everyday food is not actually mysterious, and there are widely cited reference figures for almost everything you eat. The trick is knowing which number you are looking at and why it differs from the one next to it.
This evidence review is a plain-language reference for the protein content of common foods. It answers the direct questions first, then lays out a commonly cited table for staples from eggs and chicken to beans, tofu, yogurt, and nuts, in both grams per serving and grams per 100 grams. It covers how animal and plant sources compare, which foods give the most protein per calorie and per dollar, how cooking shifts the numbers, and how to read a label. It is educational, describes food composition only, and is not diet or medical advice. For how much protein you personally need, see our protein needs review, and you can match foods to a target using the companion below.
Key takeaways
- Two large eggs carry roughly 12 grams of protein, and 100 grams of cooked chicken breast is commonly cited near 31 grams.
- Per 100 grams measures density for fair comparison; per serving reflects what a real portion delivers, and both views belong side by side.
- Animal foods tend to be dense and complete; plant foods such as beans, lentils, tofu, and soy are the strongest everyday plant sources.
- Cooking does not add or remove much protein, but water loss concentrates it, which is why cooked figures per 100 grams run higher than raw.
- All figures here are commonly cited, illustrative references for food composition, not a personal target or medical advice; confirm your own needs with a professional.
Why the protein content of food matters
High protein foods are easy to name and surprisingly hard to rank, which is why a daily target is only half of the picture, because a target is abstract until you can see it in food. The other half is knowing what your usual meals actually contribute, and that is where the protein content of common foods comes in. Someone aiming for a mid-range daily figure can hit it easily from ordinary groceries or miss it repeatedly, and the difference is rarely effort. It is usually just knowing which foods carry real protein and which only feel filling.
That gap is the reason a filling day can still be a protein-light one. A breakfast of toast, a pasta lunch, and a snack-heavy afternoon can leave someone comfortably full while contributing surprisingly little protein, with the whole day’s supply crammed into dinner. Seeing the numbers on the plate is what makes the pattern visible and fixable. This review is not about how much you should eat, which our protein needs review covers, and it is not about total calories, which our calorie needs review covers. It is about the raw material both of those depend on: what is actually in the food. Read your own foods against a target in the companion below.
Protein in 2 eggs, for reference
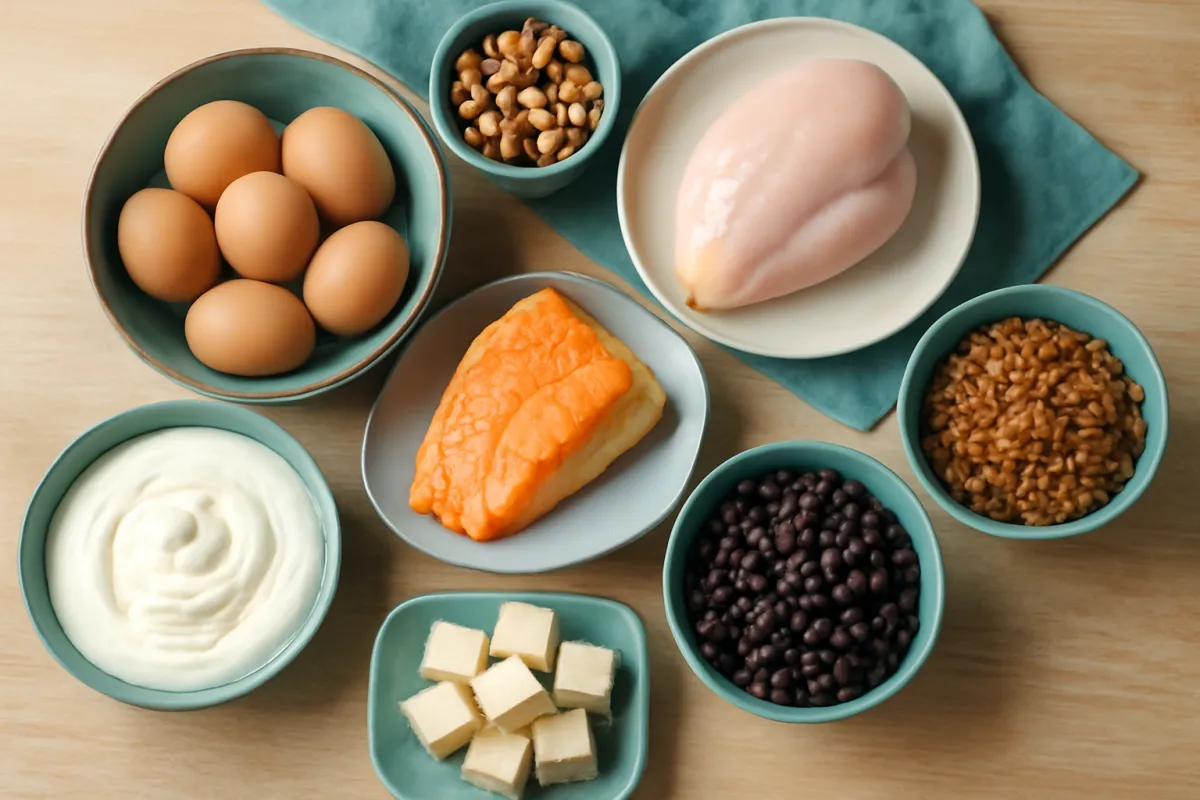
Start with the question people search for most. Two large eggs carry roughly 12 grams of protein, because a single large egg is commonly cited at about 6 grams. That protein is not all in the white, as gym folklore sometimes suggests. The white holds a bit more than half, and the yolk carries the rest along with most of the egg’s other nutrients, so eating the whole egg gives you the full amount rather than a fraction of it.
The figure moves a little with egg size. A small egg sits nearer 5 grams and a jumbo one closer to 7 or 8, but the 6-grams-per-large-egg reference is the number most food databases use and the one worth remembering. In practical terms, a two-egg breakfast is a modest but genuine protein anchor, roughly the equivalent of a small pour of Greek yogurt, and it is one of the simplest ways to keep breakfast from being the protein-light meal it so often is. Pair those two eggs with yogurt or beans and a light morning turns into a solid start, which is exactly the kind of small shift that closes the gap for people who fall short. Treat 12 grams as an illustrative reference rather than a precise reading of any particular pair of eggs.
How much protein is in 100g of chicken
The second most common question has an equally clean answer: cooked chicken breast is commonly cited at about 31 grams of protein per 100 grams, which is why it is a staple of high-protein eating. That density, close to a third of the food’s cooked weight, is near the top of what ordinary whole foods offer, and it explains chicken’s reputation as an efficient protein source.
One detail causes most of the confusion around this number. Raw chicken breast shows a lower figure per 100 grams, often in the low-20s, because raw meat still holds the water that cooking drives off. As the breast cooks and loses weight, the same protein concentrates into a smaller mass, so grams per 100 grams rise. This is not protein appearing from nowhere; it is the denominator shrinking. It also means a whole cooked breast usually weighs more than 100 grams, so a typical one carries closer to 40 or 50 grams total. When you compare figures, check whether a source lists chicken raw or cooked and try to match it to how you weighed your own, a point the section on cooking returns to. As always, these are commonly cited, illustrative values that vary with the cut, trimming, and preparation.
A commonly cited protein table for everyday foods
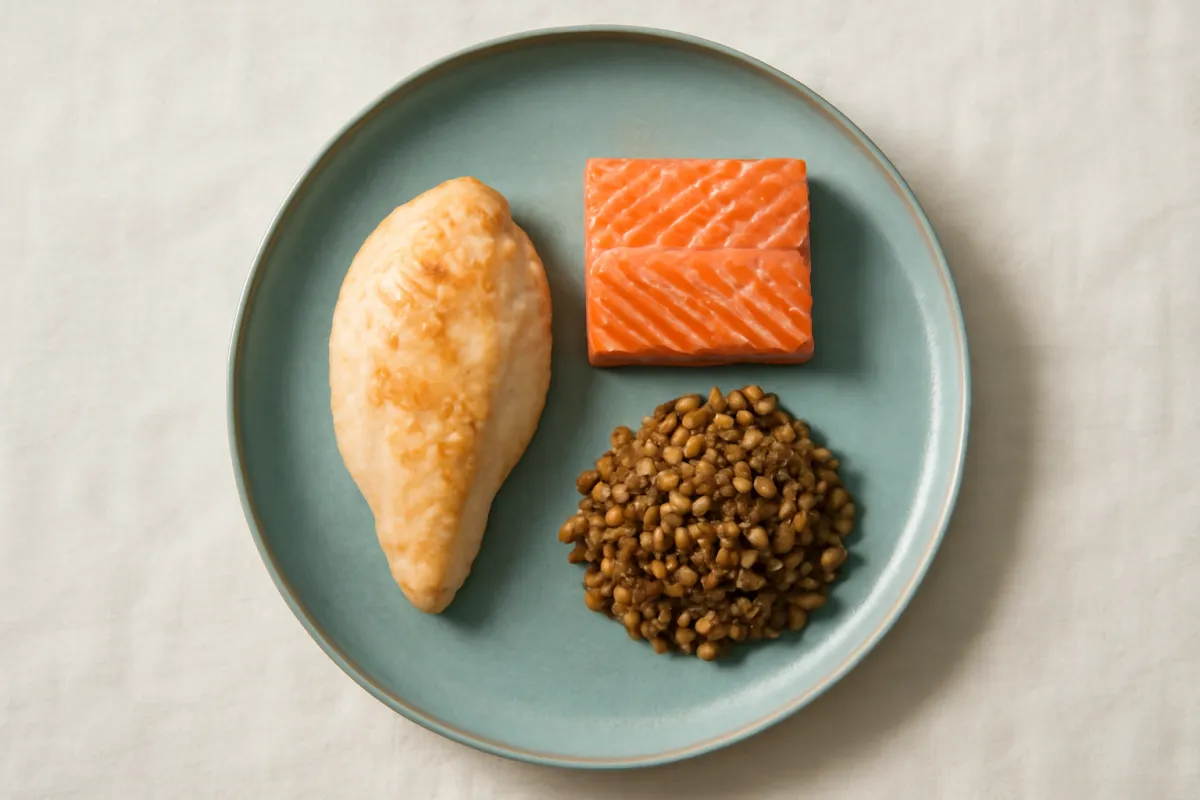
Here is the reference the rest of this review builds on: widely cited protein figures for staple foods, shown both per common serving and per 100 grams. The per-serving column tells you what a normal helping delivers; the per-100-gram column lets you compare foods on equal footing regardless of portion. Read them together, because either alone can mislead.
| Food | Common serving | Protein per serving | Protein per 100g |
|---|---|---|---|
| Chicken breast, cooked | 100 g | ~31 g | ~31 g |
| Lean beef, cooked | 100 g | ~26 g | ~26 g |
| Salmon, cooked | 100 g | ~25 g | ~25 g |
| Canned tuna, drained | 1 can (~100 g) | ~24 g | ~24 g |
| Whey protein powder | 1 scoop (~30 g) | ~24 g | ~80 g |
| Greek yogurt, plain | 3/4 cup (~170 g) | ~17 g | ~10 g |
| Lentils, cooked | 1 cup (~198 g) | ~18 g | ~9 g |
| Black beans, cooked | 1 cup (~172 g) | ~15 g | ~9 g |
| Chickpeas, cooked | 1 cup (~164 g) | ~15 g | ~9 g |
| Tofu, firm | 100 g | ~12 g | ~12 g |
| Eggs | 2 large | ~12 g | ~13 g |
| Cheddar cheese | 1 oz (~28 g) | ~7 g | ~25 g |
| Peanut butter | 2 tbsp (~32 g) | ~7 g | ~22 g |
| Milk | 1 cup (~240 ml) | ~8 g | ~3.4 g |
| Quinoa, cooked | 1 cup (~185 g) | ~8 g | ~4.4 g |
| Almonds | 1 oz (~28 g) | ~6 g | ~21 g |
| Oats, dry | 1/2 cup (~40 g) | ~5 g | ~13 g |
The table rewards a slow read. Notice how cheese, nuts, and peanut butter look strong per 100 grams but modest per serving, because normal portions are small. Notice how beans and lentils look ordinary per 100 grams yet contribute a solid amount per serving, because a cup is a generous portion. And notice protein powder, dense per 100 grams because the water and much else has been removed. Every figure is a commonly cited reference and will vary by brand, cut, and preparation, so treat the table as an illustrative map rather than a precise ledger.
A protein food chart by category
The single table above is a good general reference, but a fuller protein food chart is more useful sorted by food category, since that is usually how a shopping list or a meal actually gets built. Here is a broader, category-by-category chart covering meat and poultry, fish and seafood, dairy and eggs, legumes and soy, nuts and seeds, and grains, using the same commonly cited, illustrative approach as the table above.
Meat and poultry (per 100 g cooked): chicken breast ~31 g, turkey breast ~29 g, lean beef ~26 g, pork loin ~27 g, chicken thigh ~24 g.
Fish and seafood (per 100 g cooked): tuna ~28 g, salmon ~25 g, cod and other white fish ~23 g, shrimp ~24 g, canned sardines ~21 g.
Dairy and eggs (per common serving): Greek yogurt, 3/4 cup, ~17 g; cottage cheese, 1/2 cup, ~12 g; milk, 1 cup, ~8 g; cheddar cheese, 1 oz, ~7 g; eggs, 2 large, ~12 g.
Legumes and soy (per 1 cup cooked): lentils ~18 g, black beans ~15 g, chickpeas ~15 g, edamame ~17 g, tofu, 100 g firm, ~12 g.
Nuts and seeds (per 1 oz, about 28 g): almonds ~6 g, peanuts ~7 g, pumpkin seeds ~9 g, peanut butter, 2 tbsp, ~7 g.
Grains (per 1 cup cooked): quinoa ~8 g, oats, 1/2 cup dry, ~5 g, brown rice ~5 g, whole wheat pasta ~8 g.
Read this chart the same way as the single table above: figures are commonly cited, illustrative references that vary with brand, cut, and preparation, useful for comparing categories and building a shopping list, not for precise measurement. A printable or downloadable version is not something this review provides, since the underlying figures shift with the specific product on your shelf; your own Nutrition Facts panel, read alongside this chart, is the more exact source for any single item you actually buy.
Ranking the staples by density
To make the density comparison concrete, here are five familiar foods lined up by their commonly cited protein per 100 grams. This is the per-100-gram view, so it measures concentration rather than what a single serving delivers.
Commonly cited protein per 100 grams
Grams of protein in 100 grams of each food, cooked where relevant. Illustrative reference figures.
Bars scale to chicken breast at 100 percent. Per-100-gram density is only one view; per-serving amounts, in the table above, tell the other half of the story.
The chart shows why animal staples top most density lists, but density can mislead on its own. Lentils sit low per 100 grams yet a normal serving is a full cup, so the protein per helping is respectable, and their fiber and other nutrients come along for free. This is the recurring lesson of food-protein figures: density and portion are two different questions, and a sensible plate answers both. Use density to compare foods and servings to build a meal.
Animal protein: density and completeness
Animal foods share two traits that make them efficient protein sources. First, density: meat, poultry, fish, eggs, and dairy tend to pack a lot of protein into a normal serving, as the table shows, so they get you toward a daily target with fewer bites. Second, completeness: animal proteins are generally complete, meaning they supply all nine essential amino acids, the ones the body cannot make and must get from food, in useful proportions within a single food.
That combination is why a modest portion of chicken, fish, or eggs contributes so much, and why dairy foods like Greek yogurt and cottage cheese are popular protein anchors despite being less dense per 100 grams than meat. It is worth separating this composition fact from any health verdict, which is not what this review offers. Different animal foods carry very different amounts of fat, sodium, and other components, and food choices sit inside a whole diet that a professional is best placed to weigh for you. The narrow, factual point here is simply that animal sources tend to be dense and complete, which is what makes them convenient building blocks on a plate. What to do with that fact is a personal decision, ideally an informed one.
Plant protein: variety over any single food
Plant foods tell a more varied story. The strongest everyday plant sources are legumes and soy: lentils, black beans, chickpeas, tofu, tempeh, and edamame, commonly cited from about 12 to 20 grams per cooked cup or serving. Nuts, seeds, and whole grains add smaller amounts that accumulate across a day, and a few plant foods, notably soy and quinoa, are complete on their own. Most individual plant sources, though, are lower in one or another essential amino acid, which is the factual basis for the old advice about combining them.
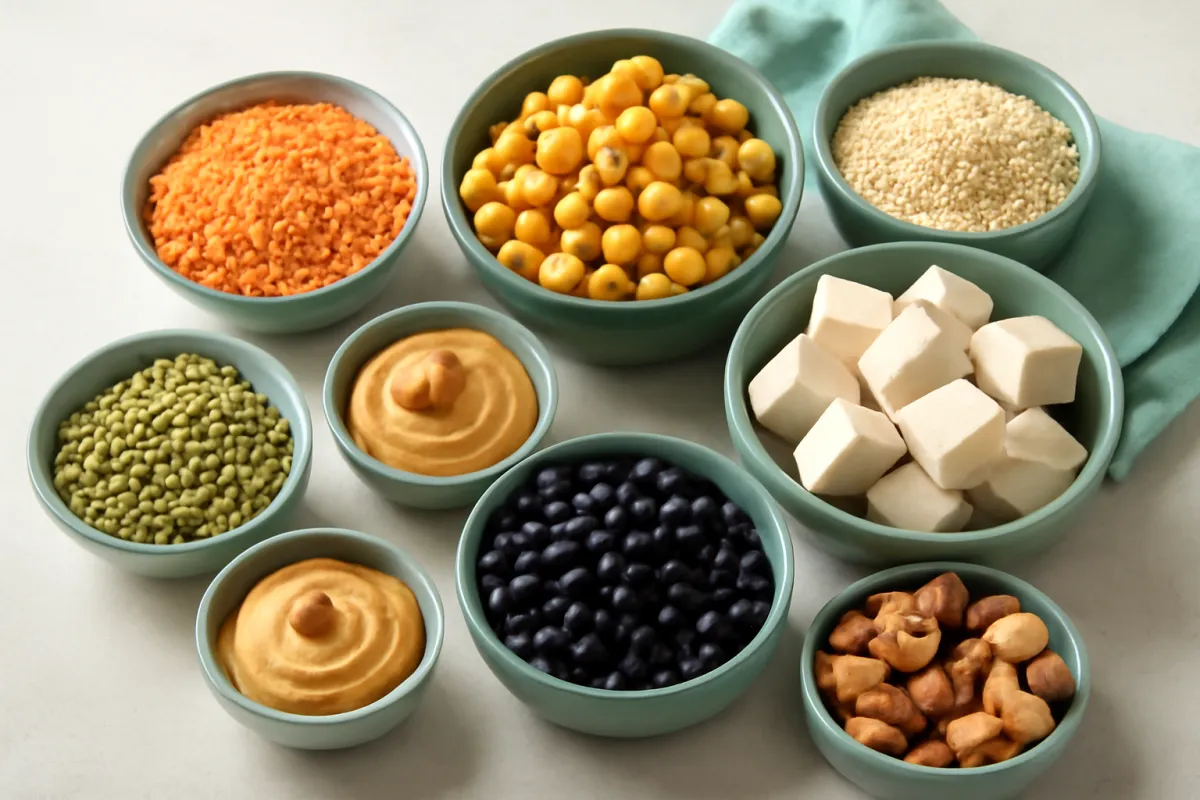
The modern, relaxed understanding is that eating a reasonable variety of plant proteins across the day covers the full amino-acid range for most people, with no need to engineer each meal. Beans at lunch, tofu at dinner, and nuts or peanut butter as a snack quietly cover the bases. Plant sources also arrive with fiber and a different nutrient profile, which is part of their appeal. The trade-off worth naming plainly is density: because many plant foods carry more water and fiber, hitting a higher protein figure from plants alone usually means somewhat larger or more frequent servings. That is a planning fact, not a barrier, and a registered dietitian can help anyone eating plant-based build it out sensibly.
High protein foods for weight loss: protein per calorie
Protein content and calorie content are separate axes, and looking at both at once reveals which foods are protein-dense relative to their energy. This matters to anyone who wants a lot of protein without a lot of calories, and it separates foods that look similar on a protein list alone. Egg whites, plain nonfat Greek yogurt, white fish, chicken breast, and canned tuna sit high on protein per calorie, delivering their protein with relatively little accompanying energy.
At the other end, foods where protein rides alongside a lot of fat or carbohydrate, such as nuts, peanut butter, cheese, and fatty cuts of meat, offer real protein but bring more calories with each gram of it. None of that makes the calorie-denser foods bad; nuts and cheese carry nutrients and satisfaction that a spreadsheet misses, and this review takes no position on what anyone should eat. The factual point is only that leanness varies widely among protein sources, so if the goal is maximum protein for the fewest calories, the lean animal and low-fat dairy options tend to lead, while the higher-fat sources deliver protein and energy together. Which balance suits you is a personal matter, and it lives inside the wider calorie picture our calorie needs review lays out.
This axis is the one people usually mean when they ask which high protein foods are best for weight loss. The mechanism is not that protein burns fat. It is that protein is the most satiating macronutrient per calorie, so a given energy budget leaves you less hungry, and a deficit you can actually live with is the one that works. Raising protein while calories fall also helps preserve lean mass, which is why intake is commonly increased rather than reduced during weight loss. Two honest caveats belong with that. Protein has calories like anything else, and foods marketed on their protein content, bars, flavoured nut butters and trail mixes especially, are frequently energy-dense enough to erase the advantage. And no single food causes weight loss; the deficit does, and protein simply makes holding one more comfortable.
Complete versus incomplete proteins, and combining
The words complete and incomplete get used loosely, so it helps to state them plainly and factually. A complete protein supplies all nine essential amino acids in useful amounts within one food; an incomplete protein is lower in at least one of them. Most animal foods and soy are complete; many individual plant foods are incomplete, being short in a particular amino acid such as lysine in grains or methionine in legumes.
The old advice to carefully pair complementary plant foods at every single meal, rice with beans at the same sitting, has softened considerably. Current understanding is that the body maintains a pool of amino acids and draws on it across hours, so eating a variety of plant proteins over the course of a day covers the essential amino acids without meal-by-meal engineering for most people. Traditional food pairings like beans and rice, hummus and pita, or lentils and grains still work beautifully, but they are a convenience and a culinary tradition rather than a strict biochemical requirement. This is a factual account of food composition, not nutrition advice; anyone building an entirely plant-based diet, or managing any health condition, is best served by confirming the details with a qualified professional.
How cooking changes the numbers
Cooking is the single biggest source of confusion in protein figures, so it deserves a clear explanation. Cooking does not create or destroy meaningful amounts of protein. What it changes is the weight of the food, mostly through water loss, and because grams of protein per 100 grams is a ratio, changing the weight changes the ratio. When chicken loses water and shrinks on the pan, its protein concentrates into a smaller mass, so the cooked figure per 100 grams reads higher than the raw one.
The practical consequence is about matching your number to your method. If you weigh chicken raw and then look up the cooked value, or the reverse, you can misjudge the protein by a meaningful margin. Good food databases list foods as raw and as cooked separately for exactly this reason, and the safest habit is to use the figure that matches how you weighed. The total protein in the piece of meat is roughly the same before and after cooking; only the concentration per 100 grams moves. The same logic applies to anything that gains or loses water in the pot, from beans that absorb water as they cook to greens that collapse. Every figure in this review is a commonly cited, illustrative reference, and this is one reason exact precision is neither possible nor necessary.
Reading a nutrition label for protein
The Nutrition Facts panel is the most reliable protein figure you will find, because it is stated in grams per serving right on the package. Two lines do most of the work. Protein is listed in grams, and serving size sits at the top of the panel. The protein number always refers to that stated serving, so the first move is to check whether the serving on the label matches the amount you actually eat, since packages often list a serving smaller than a real portion.
From there the arithmetic is simple. If a container lists two servings and you eat the whole thing, double the protein figure, and every other number too. It is worth knowing that the protein line reflects the food as sold, so a cereal’s panel may show the dry product while you eat it with milk that adds several grams more. For whole foods without a label, such as a loose chicken breast or a scoop of lentils, the table earlier in this review stands in for the panel. Reading labels for a week or two is the fastest way to learn which of your regular foods carry real protein and which only look like they do, a calibration that soon makes formal checking unnecessary.
Budget protein: the most protein per dollar
Protein does not have to be expensive, and the foods that deliver the most protein per dollar are often the plainest ones. Eggs, dried or canned beans and lentils, canned tuna and other canned fish, plain yogurt, milk, tofu, and peanut butter tend to sit near the top of protein-per-dollar comparisons, well ahead of specially marketed high-protein products. Buying dry legumes and cooking them yourself pushes the value further, and larger packages usually lower the cost per gram.
Any specific price is illustrative and shifts with region, season, and store, so treat protein-per-dollar as a way of thinking rather than a fixed ranking. The general shape holds up well, though: the humble staples that have anchored inexpensive cooking for generations, eggs, beans, lentils, canned fish, and dairy, remain among the most economical protein on the shelf. That is a reassuring counterpoint to the idea that eating enough protein requires a supplement budget. For most people, the grocery store solves the protein question at modest cost, and the marketing aisle is optional. What you actually buy is a personal choice shaped by taste, culture, and circumstance, and this review only maps the composition, not the shopping list.
The high-protein label on the front of the box
Front-of-package protein claims have multiplied, and it is worth understanding what they do and do not tell you. A high-protein or added-protein claim generally means the food cleared a labeling threshold, which is a real fact but a limited one. It does not mean the food is the best, cheapest, or most complete protein source for you, and it says nothing about the rest of the food’s composition, which may include added sugar, sodium, or a price premium for the protein positioning.
The reliable move is to ignore the front and read the back. The Nutrition Facts panel states the protein in grams per serving, and comparing that figure, and the serving size, against an ordinary food often deflates the marketing. A high-protein snack bar may carry less protein than a plain container of Greek yogurt or a can of tuna at a fraction of the cost. None of this means engineered high-protein foods are useless; they can be genuinely convenient, and convenience has value. The point is only to let the panel, not the packaging, drive the comparison. This review does not endorse or discourage any product, and choices about what to buy are yours to weigh, ideally with the label rather than the slogan in hand.
Seeing portions without a scale
Most people will not weigh their food, so it helps to translate protein figures into portions the hand can estimate. A palm-sized piece of cooked chicken, fish, or meat, roughly the size and thickness of your flattened palm, lands near a 100-gram serving and its associated protein. A deck-of-cards shape is a similar shorthand for a portion of meat or fish. A cupped handful approximates a cup of cooked beans or lentils, and a rounded scoop of Greek yogurt fills out a normal serving.
These visual anchors are deliberately rough, and that is fine, because the goal is a reliable pattern rather than laboratory precision. Once you have matched a few of your regular foods to their commonly cited protein figures, you can eyeball a plate closely enough for everyday purposes without ever owning a scale. The one caution is that hands and appetites vary, so the hand method flatters larger portions and undercounts for bigger people, which is exactly the kind of individual variation that keeps all of these figures illustrative. Used sensibly, portion visualization turns the table in this review into something you can apply at any meal, at home or out, which is the whole point of learning the numbers in the first place.
A vegetarian and vegan protein reference
Anyone eating vegetarian or vegan can meet protein needs from food, and a short reference makes the sources concrete. The core building blocks are legumes and soy: lentils, chickpeas, black beans, and other beans at roughly 15 to 18 grams per cooked cup, and tofu, tempeh, and edamame in a similar range per serving. Dairy and eggs, for vegetarians, add dense and complete options in Greek yogurt, cottage cheese, milk, and eggs. Rounding out the day are nuts, seeds, peanut and other nut butters, whole grains, and quinoa, each contributing smaller amounts that add up.
The practical approach mirrors the earlier point about variety: feature legumes or soy at most meals, lean on dairy or eggs if you eat them, and let grains, nuts, and seeds fill in the edges. Because plant foods are generally less dense, a plant-based day aiming for a higher protein figure usually involves slightly larger or more frequent servings than an omnivorous one, which is a planning detail rather than an obstacle. Fortified plant milks and soy products can help too. Our step-by-step review of how to get protein without meat turns this reference into a full meal-by-meal plan, with vegetarian, vegan, and dairy-free versions. This is a compositional reference only, and it is not a substitute for personalized advice; anyone following a fully plant-based diet is well served by checking the overall plan, including nutrients beyond protein, with a registered dietitian or doctor.
Does timing matter for these foods?
A common follow-up is whether it matters when you eat these foods across the day. Kept general and factual, the total amount of protein over a day is what most guidance treats as primary, and spreading it reasonably across meals, rather than saving nearly all of it for dinner, is a commonly suggested pattern. Practically, that means including a protein source at breakfast and lunch, not just the evening, so the day’s foods add up more evenly. The much-debated fine points of narrow post-workout timing windows are beyond the scope of a food-composition reference and are not something this review weighs in on.
The reason timing gets a mention at all is that it interacts with the foods themselves. Breakfast is the meal where protein most often goes missing, so the eggs, yogurt, milk, and even leftover dinner proteins from the table earlier are the ones that quietly fix a lopsided day. For how much and how to distribute protein for your situation, the detail lives in our protein needs review, which handles targets and distribution directly. This review stays on the narrower question of what the foods contain. As with everything here, general patterns are not personal prescriptions, and anyone with specific goals or health conditions should confirm the approach with a professional.
Building a day to a protein target
Bringing the foods together, here is how ordinary items add up across a day toward an illustrative target of about 75 grams. Nothing here is a recommendation to hit any particular number; it is simply a worked example of how the table’s figures accumulate on a real plate.
A day's protein from common foods
Illustrative meals summing to about 75 grams. Figures are approximate references.
Segments show each meal's share of an illustrative ~75-gram day. Swap in tofu, fish, or lentils and the shape holds; these are reference figures, not a prescribed target.
The example makes two things visible. First, a target that sounds large assembles easily from unremarkable meals, no shakes or oversized portions required, once each meal carries a protein source. Second, the foods are interchangeable: swap the chicken for salmon or tofu, the beans for lentils, the yogurt for cottage cheese or milk, and the day still lands near the same place, because the table’s figures are similar within each category. Set your own foods and target in the companion below to see how your usual choices add up. And keep the framing in view: 75 grams here is illustrative, chosen to show the arithmetic, not a number this review advises anyone to hit.
Whole food versus protein powder
Protein powders sit at the far end of the density table because manufacturing removes the water and much else, leaving a concentrated protein per 100 grams that no whole food matches. A typical whey scoop delivers around 24 grams of protein, comparable to a serving of chicken or fish, in a fast, portable form. That convenience is real, and for people whose appetite, schedule, or higher targets make whole-food-only impractical, a shake is a practical top-up.
The honest counterpoint is that whole foods bring more than protein. Eggs, dairy, legumes, fish, and meat carry a range of vitamins, minerals, fiber, and other components that an isolated protein powder does not, and they tend to be more satisfying and often cheaper per gram of protein than specialty products. For the large majority of people, ordinary food covers protein needs comfortably, as the table and worked example show, and powder is an optional convenience rather than a requirement. This review takes no position on whether anyone should use one; it only places powder accurately on the composition map, as a dense, convenient source that supplements a diet built on food rather than replacing it. Anyone with a health condition should check with a professional before adding supplements.
High protein breakfast foods
Breakfast is where most protein-light days are decided, because the conventional options are the weakest on this axis. Toast, cereal, porridge made with water, fruit, and pastries are all reasonable foods that simply do not carry much protein, and a morning built from them leaves the whole day’s supply to be recovered at dinner.
The foods that fix it without redesigning breakfast are mostly familiar. Eggs in any form. Plain Greek yogurt, which typically carries roughly twice the protein of standard yogurt for similar calories. Cottage cheese, either savoury or with fruit. Milk or unsweetened soy milk in place of water on porridge, which lifts the bowl meaningfully for no change in effort. Smoked salmon, tinned fish, or leftover chicken for anyone who does not mind a savoury start. Unsweetened soy milk is the plant option that comes closest to dairy on protein; most other plant milks carry very little.
The swaps that do the most work are the ones that change nothing else about the meal. Porridge made with milk instead of water. Greek yogurt instead of standard. An egg alongside the toast rather than instead of it. Each is small on its own, and together they typically move a breakfast from a token amount of protein to a genuine contribution toward the day.
High protein foods for building muscle
The food list here is not different from the general one, which is the first useful thing to know. Muscle gain does not require exotic sources; it requires enough total protein, spread reasonably across the day, alongside resistance training and adequate overall calories.
Where the emphasis shifts slightly is toward completeness and leucine content. Animal sources, eggs, dairy, fish, poultry and meat, along with soy, provide all the essential amino acids in proportions that support muscle protein synthesis well. Plant sources other than soy tend to be lower in one or more essential amino acids individually, which is why variety across the day matters more on a plant-based diet than any single meal’s composition does.
Distribution is the part most often neglected. A day that reaches its total through one very large evening meal is not the same as one that spreads similar amounts across three or four eating occasions, and the spread is generally the better pattern for this goal. Our protein per meal review covers that in detail, and how much protein you need covers what the total should be.
The honest caveat: no food builds muscle by itself. Protein supplies the raw material, training supplies the stimulus, and without the second the first is simply stored or used as energy like anything else.
Common mistakes when reading protein numbers
A few recurring errors explain most of the confusion around food-protein figures, and each is easy to avoid once named.
- Mixing up raw and cooked. The same food reads differently per 100 grams depending on its water content, so match the figure to how you weighed it.
- Reading per 100 grams as per serving. A food dense per 100 grams can contribute little per serving if the portion is small, and the reverse holds for large portions.
- Trusting the front of the package. A high-protein claim is a threshold, not a verdict; the Nutrition Facts panel is the honest number.
- Ignoring serving size on the label. The protein figure refers to the stated serving, which is often smaller than what you actually eat.
- Judging a food by fullness. Feeling full is not the same as eating protein, and many filling foods carry surprisingly little.
- Treating illustrative figures as exact. Every number here is a commonly cited reference that varies by brand, cut, and preparation.
Each of these is a reading error rather than an eating error, and clearing them up makes the table far more useful. The numbers are only as good as your understanding of which number you are looking at.
A quick food-protein reference checklist
Turn the review into a habit with a short routine you can apply at any meal.
- Anchor breakfast with protein, using eggs, yogurt, milk, or leftovers, since morning is where days most often fall short.
- Read both columns in the table, per serving for a real plate and per 100 grams for fair comparison between foods.
- Match raw or cooked figures to how you measured, especially for meat and legumes.
- Check the label’s serving size before trusting its protein number, and scale it to what you actually eat.
- Favor variety across plant sources if you eat plant-based, so the amino acids cover across the day.
- Confirm your personal target with our protein needs review and, if health conditions apply, a professional.
Run your own foods against a target in the companion below to see where an ordinary day lands.
The bottom line
The protein content of common foods is not a mystery once you know which number you are reading. Two large eggs carry roughly 12 grams, 100 grams of cooked chicken about 31, and the rest of the everyday staples fall into place around them, dense animal sources near the top, legumes and soy leading the plant list, and small servings of cheese and nuts contributing more than their portions suggest. Read per serving for a real plate and per 100 grams to compare foods, match raw to raw and cooked to cooked, and let the Nutrition Facts panel outrank any front-of-box claim. Do that and a daily protein target, whatever yours turns out to be, assembles from unremarkable groceries rather than a supplement aisle. Every figure here is a commonly cited, illustrative reference for food composition, not a personal prescription, so pair it with our protein needs review for how much you need, and confirm anything specific to your health with a qualified professional.
This evidence review is published for education and describes the commonly cited composition of foods, not medical, dietetic, or dietary advice, and reading it creates no clinician-patient relationship. Every protein figure, serving size, and cost comparison above is an illustrative, widely referenced average rather than an exact measurement or a personal recommendation, and real foods vary by brand, cut, ripeness, and preparation. This article does not tell anyone how much to eat, endorse any product, or make claims about weight or health conditions. For a protein target suited to your body, goals, medications, pregnancy, or any medical condition, consult a qualified health professional such as a doctor or registered dietitian.
Frequently asked questions
What foods are highest in protein?
Per 100g of the food itself, the leaders are lean animal sources: chicken breast, turkey, lean beef, white fish, tuna, and prawns all sit at the top, with eggs and dairy somewhat lower per 100g but very easy to eat in quantity. Among plant foods, seitan is unusually high, followed by tempeh, tofu, edamame, lentils and beans. The ranking changes if you measure per serving rather than per 100g, because portion sizes differ enormously: nuts are protein-rich per 100g but nobody eats 100g of almonds in a sitting, while 100g of chicken is an ordinary portion. It changes again per calorie, where egg whites, nonfat Greek yogurt and white fish lead. Which ranking is the useful one depends on whether you are choosing a meal, a snack, or eating within a calorie limit.
Which high protein foods are best for weight loss?
The ones that deliver protein at a low calorie cost, because that is the whole mechanism: protein is the most satiating macronutrient per calorie, so the same energy budget leaves you less hungry and the deficit becomes easier to hold. Plain nonfat Greek yogurt, cottage cheese, egg whites, white fish, prawns, chicken breast and tuna in water sit at the strong end. Edamame, tofu and lentils add fibre alongside the protein, which contributes to fullness for little extra energy. Two cautions. Protein-marketed products such as bars and nut butters are frequently energy-dense enough to cancel the advantage. And no food causes weight loss on its own; the calorie deficit does, and protein makes living with one more comfortable.
How much protein is in 2 eggs?
Two large eggs carry roughly 12 grams of protein in total, since one large egg is commonly cited at about 6 grams. Most of that protein is split between the white and the yolk, so eating the whole egg gives you the full amount rather than the white alone. The figure shifts a little with egg size, from small to jumbo, but 6 grams per large egg is the number most food databases use. Treat it as an illustrative reference for everyday planning rather than an exact measurement of any particular egg.
How much protein is in 100g of chicken breast?
Cooked chicken breast is commonly cited at around 31 grams of protein per 100 grams, which is why it appears so often in high-protein eating. Raw chicken shows a lower number per 100 grams because it still holds the water that cooking drives off, so the same piece concentrates its protein as it cooks and loses weight. A typical cooked breast weighs more than 100 grams, so a whole one often lands near 40 to 50 grams. These are illustrative figures, and the exact amount depends on the cut, trimming, and cooking method.
Which common foods have the most protein per 100g?
Among everyday whole foods, cooked chicken breast, lean beef, and fish such as salmon or tuna sit near the top per 100 grams, commonly cited in the mid-20s to low-30s of grams. Hard cheeses and nuts look high per 100 grams too, though their normal servings are small. Protein powders are denser still per 100 grams because water and most other components have been removed. Comparing foods per 100 grams is useful for density, but per common serving matters more for a real plate, and both views appear in the table in this review.
Do plant foods have as much protein as meat?
Many plant foods carry meaningful protein, but most are less dense per serving than meat, fish, eggs, or dairy, and several are lower in one or another essential amino acid. Beans, lentils, tofu, and soy foods are the strongest everyday plant sources, commonly cited near 15 to 20 grams per cooked cup or serving. Eating a variety of plant proteins across the day covers the full amino-acid range for most people without any special combining at each meal. This review describes food composition only, and a registered dietitian can tailor a plant-based plan to your needs.
What does protein per 100g versus per serving mean?
Per 100 grams is a standardized way to compare the protein density of foods on equal footing, which is helpful because portion sizes differ so widely. Per serving reflects how much protein you actually get from a normal helping, which is what matters when you build a plate. A food can look modest per 100 grams but contribute a lot per serving if you eat a large portion, and the reverse is also true for dense foods eaten in small amounts. Reading both columns together, as the table here does, gives a fuller and more honest picture.
Does cooking change how much protein a food has?
Cooking does not create or destroy meaningful amounts of protein, but it changes the weight of the food, mostly through water loss, which changes the grams per 100 grams. That is why cooked chicken shows a higher protein figure per 100 grams than raw chicken: the protein is more concentrated once water cooks off. Databases usually list foods as raw or cooked separately for this reason, so it helps to match the label to how you weighed the food. The figures in this review are commonly cited values and are illustrative rather than exact.
Are high-protein labeled products worth it?
A front-of-package high-protein claim tells you a food cleared a labeling threshold, not that it is the best or most economical source of protein for you. Many ordinary foods, such as eggs, plain yogurt, beans, and canned fish, deliver substantial protein at a lower cost per gram than specially marketed products. The Nutrition Facts panel, where the protein line is stated in grams per serving, is a more reliable guide than the marketing on the front. This review is educational and does not endorse any product; compare the labels and decide what fits your budget and preferences.
How much protein should I aim for from these foods?
Your daily protein target is a separate question from the protein content of foods, and it depends on body size, activity, age, and goals, which our companion protein needs review walks through. Once you have a rough target, the table and worked example here show how ordinary foods add up to it across a day. General guidance and population figures are not a personal prescription, and needs can differ with medical conditions, medications, pregnancy, and age. Confirm your own target with a qualified health professional such as a doctor or registered dietitian before making changes.

Hamza Hai is the editor of NourishMark. She holds an MBA and reviews the site's articles against our editorial standards, checking that every figure is labelled for what it is, that nothing is presented as verified fact without a source the reader can check, and that the writing stays useful to a non-specialist.

Dr. Shayaan Khan is the medical reviewer for NourishMark. He holds an MBBS from MGM Medical College, Navi Mumbai, and is the author of published research including a narrative review of postpartum anxiety and depression in Mental Health Science. He has taught physiology at university level. He reviews the site's health content for medical accuracy: that physiology and mechanisms are described correctly, that no claim is stated more strongly than the evidence behind it, and that anything specific to an individual reader is sent to that reader's own clinician.
Not medical advice. Dr. Khan reviews NourishMark's health content for medical accuracy. He is not a registered dietitian, he does not hold a United States practising licence, and he is not your doctor. His review does not make anything here medical advice. Always talk to a qualified health professional about your own situation, and never delay or stop care because of something you read here.